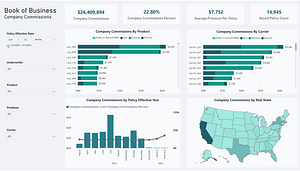
One of the most powerful features that LeapFrogBI offers is the ability to visually describe a project in the form of an interactive graph. Users have the ability to view a project cross section, data model, or the entire project data flow with the click of a button. Best of all, these graphs are automatically generated based on project lineage definitions. Communication between developers and business uses is greatly enhanced by using this visual aid.
What does the Graph Represent?
LeapFrogBI is a metadata driven ETL application. This simply means that developers define a project instead of writing any code. With the definition in place, the LeapFrogBI engine is then able to read the definition and generate all of the required code. The graphs provide a visual representation of component level logic that has been defined.
What is a Component?
Each node of the graph represents a single component. Data flow diagrams often contain hundreds of nodes each with a specific relationship to other nodes. This chain of dependencies traditionally has prohibited rapid response to changes to a project’s target data model. By breaking the logic down to a component level, developers can form virtually any logic while also ensuring that the logic is loosely coupled. This is key to both rapid development as well as incremental change.
What do all of the Colors Represent?
The graphs are arranged by component type. Each type is has a correlated color. This makes is easy to understand the graph at a glance.

The above data flow segment represents is focused on the yellow highlighted node, “F fact_Sales”. Navigation between components is easily achieved by clicking on the desired graph node. After doing so, the graph will reload showing all components related to the selected component, both up and downstream.
Yellow = Selected Component
The currently selected component will be outlined in red and highlighted in yellow. This makes it easy to determine which component is driving the visualization.
Gold = Stage Components
A stage component is tasked with collected data from a source and loading it into a controlled destination. This is a volatile destination location meaning the data is deleted from the destination prior to each component execution.
Silver = PSA Components
A PSA component is a historical store. PSA stands for persistent staging area. All versions of all records are stored in this historical store based on the fields which the developer chose to track changes on.
Carrot = Transform Component
A transform component manipulates the data that collected from its source and created either a volatile table to store the data or a view to represent the transformation. Pivots, set operations, aggregations, filters, and many more transformations are possible.
Light Blue = Dimension Component
A dimension component represents a dimension in the target data model. Dimensions typically contain attributes that describe related facts. Common dimensions include product, customers, and date.
Light Green = Fact Component
A fact component is a storage area for the data which represents business events typically called measures. Facts are related to dimensions to describe each measure context. For example, a fact table may contain a measure called “Amount”. This fact table may then be related to the product and date dimension to describe the product and time context of the related Amount value.
What Do all the Lines Represent?
Data flow is all about taking data from one place and putting it in another. The lines represent the flow of data from one component to another with the arrow dictating the data flow directly.
Black Lines = Source to Target Lineage
Simply enough, one component’s output becomes another component’s input. Developers are able to redirect lineage by making definition changes while ensuring all dependencies are not broken.
Red Lines = Joins Between Components
When a field from one component is needed in another component, the two components must be joined together. Developers achieve this by selecting the type of join and a join condition.
Blue Lines = Foreign Key
Fact tables include relationships to dimensions. This is a special kind of join because it is involved with ensuring that the target models integrity is maintained and typically describes the grain of a fact table.
Green Lines = Load Options
At times developers need to load a dimension or fact using more than one source. When the sources are not able to be synchronized, load options allow multiple data flow paths to target the same destination component.
How Do I See the Target Model?
Simply click the model button and the project data model will be displayed. The colors and lines have the same meaning as described.

How can I See the Total Data Flow?
Click the data flow button on the far right to view a project’s entire data flow. Keep in mind that projects that contain many components will return a large data flow graph. This my be helpful in finding specific areas of the project to focus on.

What does the “Show Graph” Option do?
Component relationships can be represented visually or in text form. By unchecking the “Show Graph” option, the text navigation will be displayed.

How about the “Extended Map” Option?
The graph can include either all upstream and downstream components in relation to the selected component, or it can show only the components that are directly related to the selected component. The same selection will impact both the text and visual component graph.
Things to Remember
- The color coding explained above is consistent throughout the LeapFrogBI platform.
- When viewing a component header clicking on a component will direct the viewer to the selected component’s header. Same is true when navigating within the component detail.
- Navigation options are set in the component header only. Settings will persist when viewing component details as well as on subsequent browser sessions.
- The option to view the project model & data flow is available in the component header only.