A Recipe for Transforming Data Into Insights that Improve Business Outcomes
The failure rate for business intelligence projects is high. Exactly how high is up for debate, but high enough to cause discomfort.
This stems from the fact that most companies treat BI like a project to be undertaken then forgotten. But much like sales or marketing, business intelligence is a critical business function, not a project. To achieve success, companies must acknowledge this reality and make an ongoing commitment to analytics.
This, in turn, requires an agile BI approach that can adapt as needed to the evolving data and needs of the business. For companies interested in implementing an agile business intelligence function we developed these 10 Steps to Business Intelligence Success.
The critical distinction that separates this approach from the traditional, project approach to BI and data warehousing (besides the fact that this approach has a 100% success rate) is that this is an ongoing process in which all 10 steps are happening at the same time, in perpetuity.
Step 1 – Understanding business needs
To have any chance of success with business intelligence, the business must first define what success looks like, and this can be a problem. At the start of this process business users often don’t know what they want because they haven’t had adequate access to data and may lack a clear idea of what’s possible. Even if the business can define some requirements, IT won’t yet know what can and can’t be delivered because they must first understand the business requirements then compare them to the available source data to find any gaps.
To alleviate this problem we created a BI Requirements Survey that clients can access on an ongoing basis to populate a desired insights database. This allows for requirements to change over time and forms the basis for goal setting at the start of every sprint.
Step 2 – Data gap analysis
Business requirements form one half of the equation when defining the goal pool. The available data forms the other half. Through a careful examination of the available data, in consultation with the various subject matter experts, we’ll evaluate and consistently re-evaluate which goals can be supported and will provide the greatest business benefits. The outcome from this process is a list of goals that can be achieved and an estimate of the effort each will require to accomplish.
Step 3 – Goal selection & prioritization
One of the great advantages of utilizing a truly agile process is that the technical solution can adapt rapidly to changing requirements and data without unnecessary delays because each development cycle brings a new opportunity to reevaluate everything we know and adjust the goals and strategy accordingly.
At the beginning of each sprint we meet with the business stakeholders to review the goal pool, confirm the relative priority of each goal, and define the scope of effort based on the agreed upon cadence.
Step 4 – Detailed requirements & design
Any time a goal is prioritized for development we conduct a detailed requirements gathering process that may consist of interviews with stakeholders, subject matter experts and data stewards. The result of this process is a user story that not only describes the desired insight and how the business would like to see the information, but also all of technical detail necessary to source, transform and load the data in the desired form. By combining discovery and design, we are able to move extremely quickly and avoid unnecessary delays that typically result from a time delay between requirements gathering and technical design.
Step 5 – Data solution selection
The data solution is the portion of the technical solution that acquires data and makes it report-ready. The data solution (not the reporting software) is the most important factor in determining what types of reporting can be produced, and by whom. It can range from direct source system reporting to an enterprise-wide dimensionally-modeled data warehouse. This need may change over time based on requirements, and it isn’t unusual for a single company to require multiple data solutions at one time.
As it is the heart of the technical design, we constantly reevaluate the data solution. We’ve developed a Data Solution Workshop and a set of Data Solution Selection Criteria that we use to guide this process and ensure that every client has the technical solution that’s right for them at all times.
Step 6 – Data preparation
We develop the custom algorithms (ETL) necessary to automatically prepare data nightly and load the data solution(s). In order to speed this process and facilitate an agile cadence we’ve spent years developing a proprietary data warehouse automation platform that eliminates 90% of the effort compared with hand coding.
When completed, the data preparation processes eliminate all manual effort by automating the integration, cleansing, organization, and summarization of the data. They effectively transform raw data into information that can be readily understood by anyone and efficiently investigated using any reporting application.
Step 7 – Data modeling
As reporting requirements become more advanced (for example, combining the requirement for massive calculations with the need for instantaneous response times) we introduce advanced data modeling techniques to create specialized or pre-aggregated views of the data. By layering these models over the underlying data solution it is possible to meet the most demanding reporting requirements without sacrificing the integrity and performance of the core data solution.
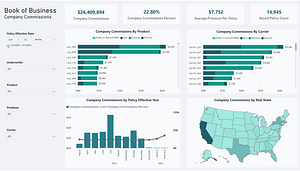
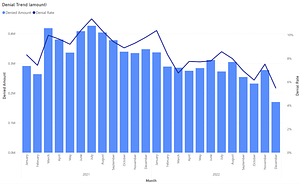
Step 8 – Data visualization
For years companies have been buying reporting software, such as Cognos or Business Objects, hoping to solve their reporting challenges with a single purchase. Today, companies are buying newer tools like Power BI and Tableau with similar expectations.
While these tools alone can’t easily solve the age-old problem of “garbage in, garbage out,” they play a critical role as the user interface once the data has been prepared and is report-ready. We leverage one or more reporting applications (based on specific requirements) to effectively communicate the story the data is telling and reveal important insights. This may include developing visualizations, dashboards, scorecards, self-service reporting, report distribution and threshold-triggered or exception-based notifications.
Step 9 – User feedback
The traditional, project-based approach to data warehousing and business intelligence has one fatal flaw. The discovery process is compressed into the shortest possible time frame so an “accurate” plan can be created before design begins. After discovery, end-users sit idly on the sidelines until the entire system has been developed and is ready for testing. By then, months have passed and business priorities and reporting requirements may have shifted. New data may also have become available, and source systems may have been upgraded or migrated. So even if the team succeeds in building a working solution, it may no longer be what the business needs, or at the very least it will need further modification.
The agile business intelligence methodology solves this problem completely by accepting the iterative nature of BI development and adapting accordingly. The scope of each sprint is kept small, and as a result users are involved constantly so there are no more surprises. The development team receives immediate feedback on every user story, no matter how small, and can adapt to changing requirements without unnecessary delays.
Step 10 – Data governance
Invariably, every business intelligence project shines a spotlight on the organization’s data quality. Issues may exist if business processes don’t enforce data quality, or anytime various systems treat customer or product information differently.
The final, critical ingredient for business intelligence success is to engage all stakeholders in an ongoing effort to govern and manage master data and metadata that feeds the data warehouse or alternative data solution. Companies that embrace this step and dedicate the necessary resources are rewarded with the competitive advantage that comes when everyone in the company has the information they need to optimize their portion of the business.