Report Description
- Industry: Healthcare
- Audience: Providers, Business Managers, Practice Managers
Use case
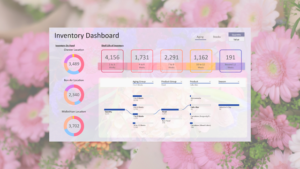
This dashboard provides an example of how easily healthcare data can be consumed using Power BI or similar tools after it has been made “report-ready”.
Productivity is a fundamental measurement for any business, including healthcare. Dashboards like these can be used to show growth, provider performance, area trends, and stability. Nearly all entities in a healthcare practice can use productivity reports to gauge performance against goals.
Questions this report answers:
Which practice is growing? Which region? – View the trends by year, area, or specific practice.
Which payers generate the most revenue? – See which insurance companies make up most of the business. How long does it take for each insurance company to make a payment? Which ones are not profitable?
Which providers are producing? – Providers are the sales force of your business. Learn which providers are bringing in the most clients and for which segment of your practice.
How to Use this Dashboard
Hover
You can hover over many chart elements, like a bar in a bar chart, to reveal additional details.
Filter by clicking chart elements
All of the charts on a page can also act as filters for each other. For example, click a dimension, like a CPT code or state, and all related charts will update automatically. To clear the filter, click the same dimension again.