Insurance Reporting and Data Analytics
Improve loss ratios, understand the impact of rate changes, find your top producers, and much more. LeapFrogBI’s Managed Analytics offering transforms your raw data into some of your most valuable assets, knowledge & insights.

Unlocking Insurance Data Insights
At LeapFrogBI, we understand the unique challenges faced by insurance carriers, MGAs, MGUs, wholesalers, and brokers.
In the vast and complex world of insurance, LeapFrogBI has seen it all. From sales production to profitability and operational efficiency, we know how to transform raw data into the information needed to make informed decisions.
Our insurance data, reporting, and analytics solutions are built for your business, your team, and your clients.
MGAs, Brokers, Agents, Wholesalers, and Carriers...
We've got you covered!
Insurance Claims Management
Processing claims is a labor-intensive activity. Complex workflows compound with lengthy authorization and review chains to challenge managers, demanding them to keep track of constantly changing data states.
Strong data integration skills and deep understanding of business rules are critical factors for a successful claims management reporting solution.

Insurance Claims Management
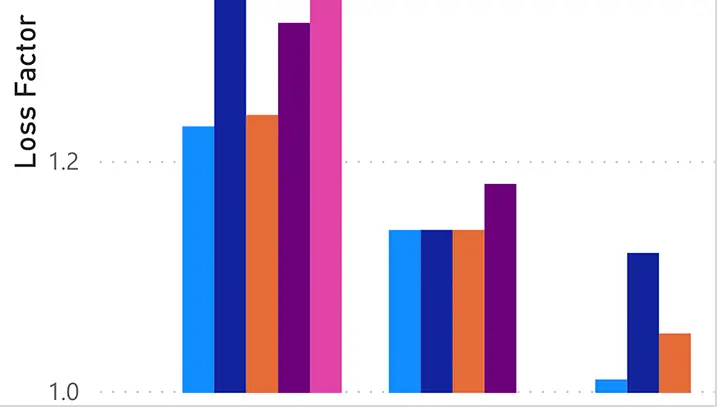
Loss Ratio and Loss Triangle Reporting
Few businesses are as forward-looking as Insurance. A complete understanding of past performance and current trends is an absolute necessity for sound actuarial decision-making. The complex time dynamics of occurrence, reporting and payment need to be precisely captured to support reliable profitability reporting and a solid pricing strategy.

Loss Ratio and Loss Triangle Reporting
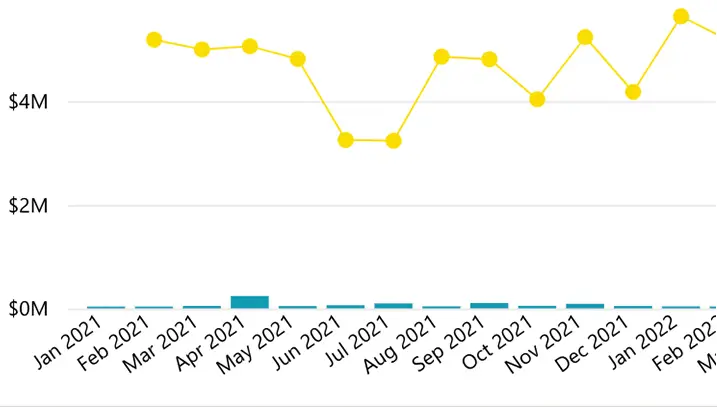
Written and Earned Premium Reporting
Sales production reports tell managers the direction in which their business is growing. It’s important to understand the performance of lines, client segments, geographies, and producers. Beyond Written Premium production, managers will want to understand their Earned Premium accrual patterns and how they will impact the profitability of their book.
Written and Earned Premium Reporting
Insurance Sales and Marketing Reports
Fierce competition and constant innovation put pressure on leaders to carefully manage customer acquisition costs. Understanding which markets and approaches are not working is the difference between getting a return on your investment or losing it all.

Insurance Sales and Marketing Reports
Data Feeds and Regulatory Reporting for Insurance
The insurance industry’s value chain is a complex web of inter-relationships between firms and regulators. Maintaining a constant and efficient data flow between entities is in every participant’s best interests. Well-curated and architected data stores are the foundation supporting that tight interaction.

Data Feeds and Regulatory Reporting
Program Management Reporting
As a large variety of risks gets pooled and ultimately absorbed by multiple carriers, insurance companies look for ways to understand the performance of different programs. A perspective into which strategies are effective and which are not influences the outcomes for multiple players in the risk ecosystem.

Program Management Reporting
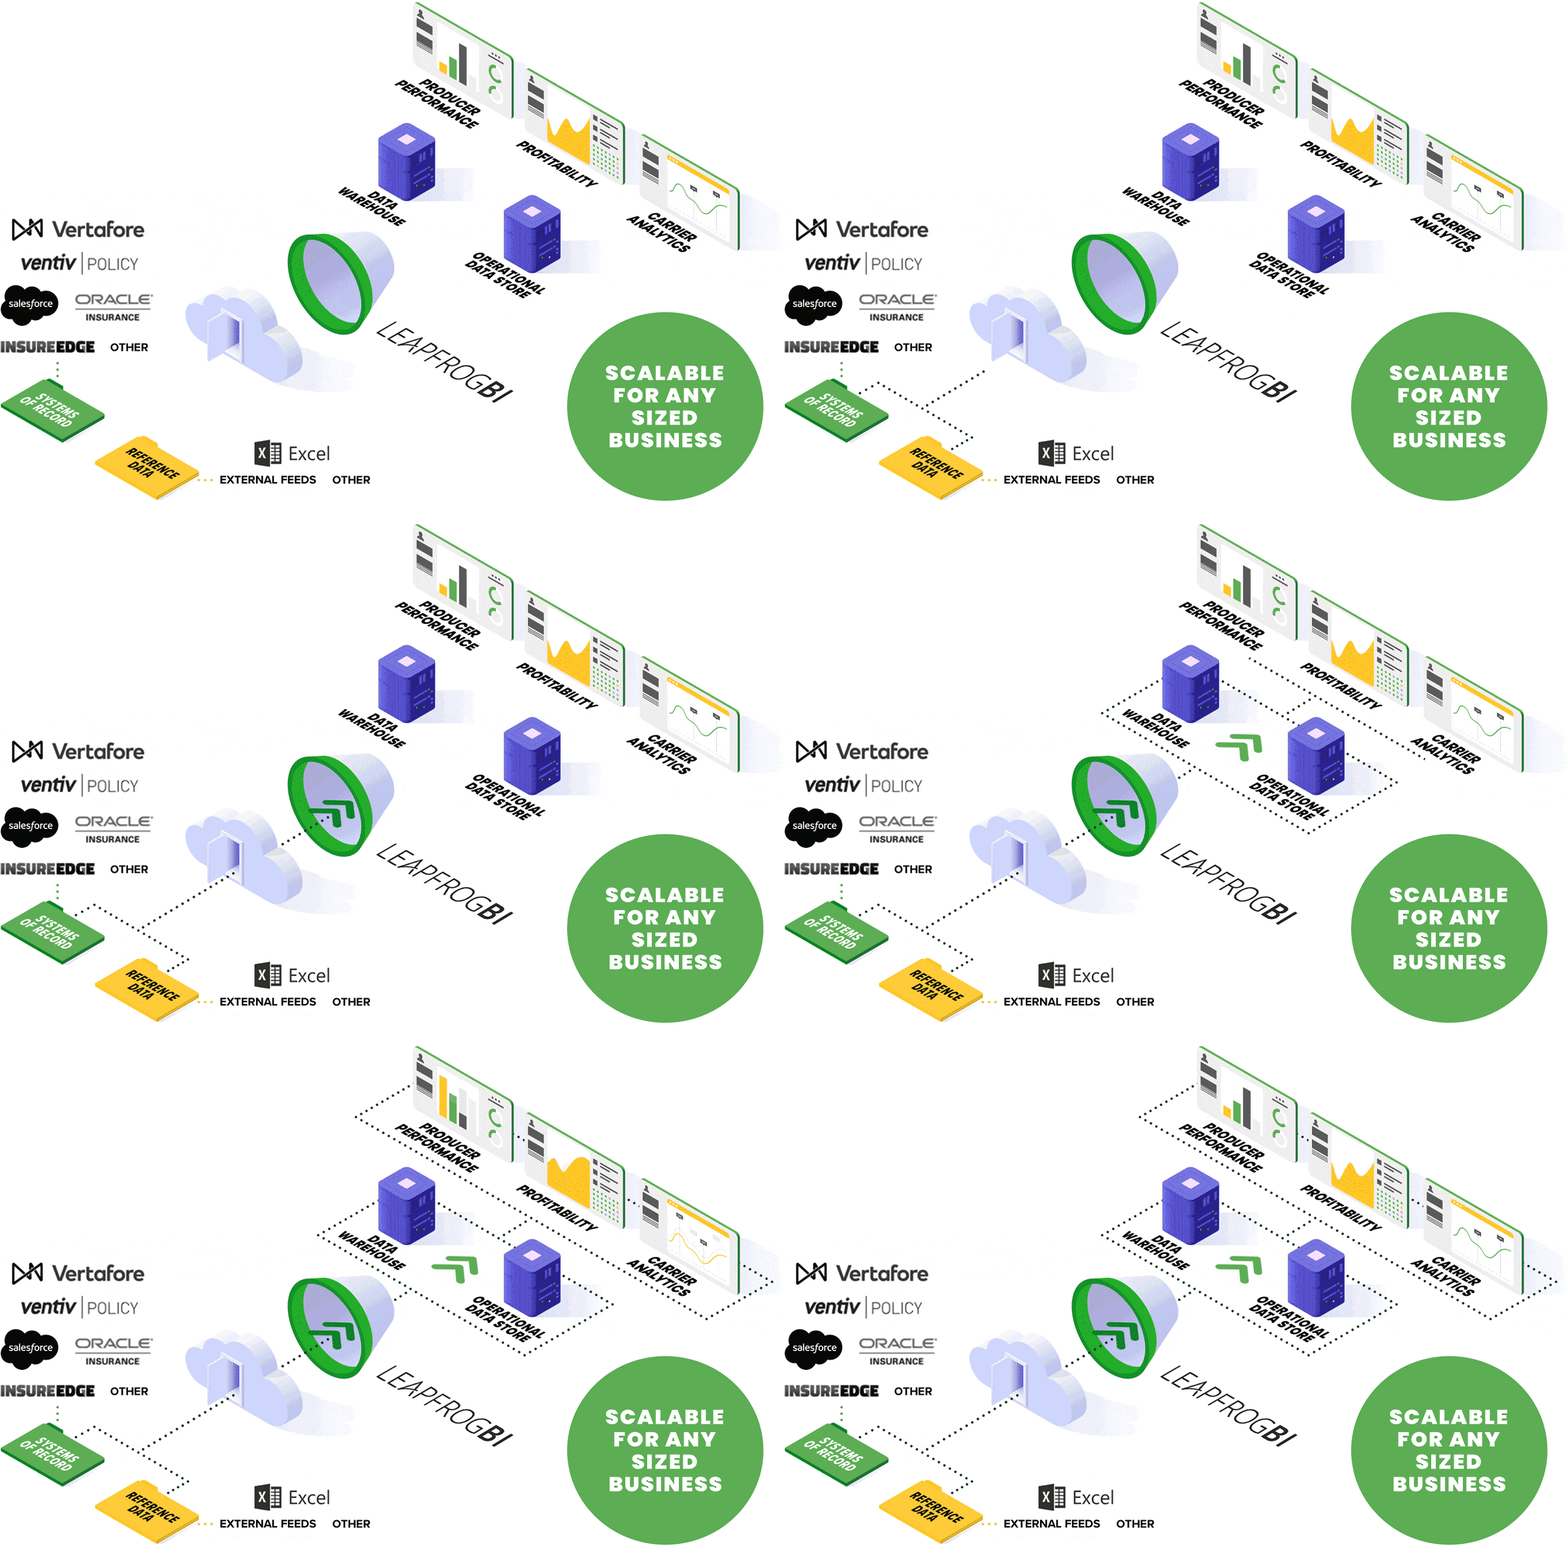
Seamless Data Integration Across Leading Insurance Platforms
“We’ve been able to figure out if we are charging enough rate to realize our premium goals. Thanks to LeapFrogBI, we now have all the detailed data available to us and we can work with our underwriters to find the right balance when it comes to discounts and getting new customers.”

JENNIFER GRAHAM, VP DATA OPERATIONS
PARAGON INSURANCE HOLDINGS
Insurance Reporting Examples
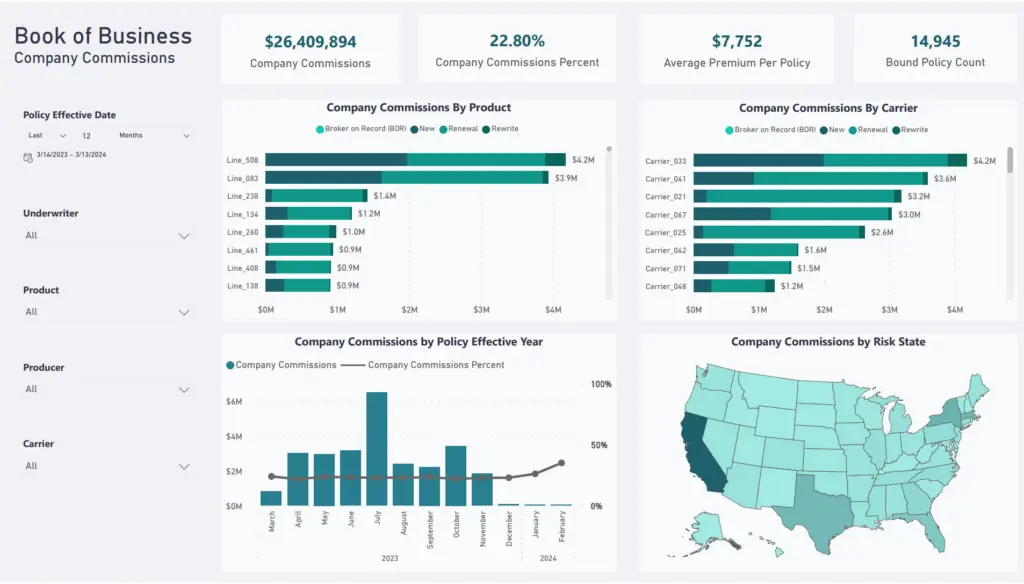
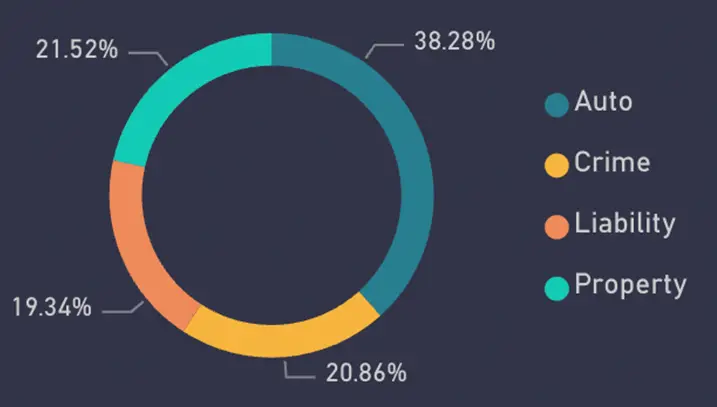
Whether you require financial performance analysis, operational efficiency insights, or other specific metrics, we provide flexibility and versatility. Here are a few examples of our interactive dashboards:
Trusted by the Best in their Industries

