How much loss can be expected per claim? Answer this simple question correctly, and carriers and MGAs will have a good chance of building a successful business. Understanding expected losses is core to actuarial work and ultimately drives rating algorithms that underwriters use to calculate premiums.
Insurance offers the insured a hedge. Insureds transfer risk to insurers for a fee (premium). For the insured to calculate the price of a policy accurately, it is crucial to calculate an accurate expected loss per claim. The quoted premium needs to exceed expected losses plus expenses and a profit margin. Expenses and profit margins are simple enough to calculate, but how is expected loss derived? Perhaps the best information available is historical claims. We will focus on how to use historical claims to estimate expected future loss per claim and ensure reserves and premiums are accounting for expected losses.
How to Determine Expected Losses
What to Expect
One way to determine expected loss is by looking at a history of claim (empirical) performance. The assumption is that future claims will likely see similar loss patterns as compared to historical claims. However, there is a complicated factor. Claims can take a very long time to mature.
A claim is first reported (reported date) to the policy’s designated claim processor. The insured provides the date of loss and the nature of the claim. An initial payment (incurred) will be made to the insured assuming the claim meets the policy coverage criteria. Over time, additional payments may be made to cover additional losses. To model this scenario, we can use loss triangles such as the below matrix.
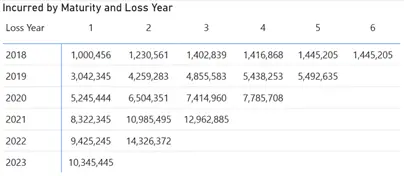
On rows we have the Loss Year. This is the year that the calendar loss occurred as reported by the insured. Columns represent maturity such that 1 equals the end of year one, 2 equals the end of year two, etc. Finally, the measure represented is the total incurred as of the maturity period for each loss year. If we look at loss year 2020, we can see that at the end of the second year (2021) 6,504,351 in incurred losses have been paid.
This basic visual shows how claims are maturing through time which is crucial to understanding the ultimate amount that will be paid out. The triangle shape is formed due to the lack of maturity for recent loss years.
Using Loss Factors to get Closer to the Answer
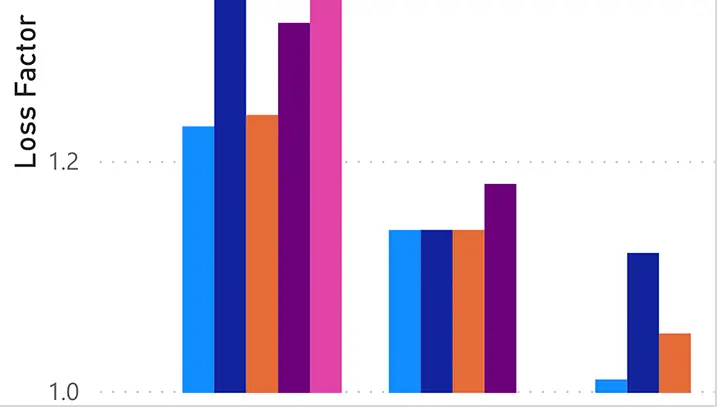
While seeing the actual losses over time is helpful, it can’t directly tell us how much incurred a claim will accumulate over time. The loss factor can help us get closer to this answer.
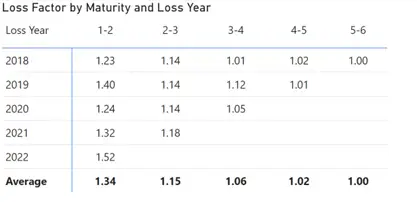
The loss factor tells us how much difference in incurred losses was paid between periods. For example, in 2020 if we compare year two losses to year three losses, we can see a 14% increase in the incurred amount resulting in a loss factor of 1.14. We repeat this exercise for all period comparisons to create the above triangle representing loss factors.
The loss factor triangle also has the critical “Average” row. This row is averaging the factors of all loss years for a given maturity. What can we do with this number?
1.34 x 1.15 x 1.06 * 1.02 * 1 = 1.67
When you multiply all the periods together, we come up with 1.67 as the ultimate factor. For every dollar paid in claims during maturity year 1, the carrier can expect to pay 1.67 times this amount once the claim is settled. Now we have a way of calculating the expected loss per claim. Let’s look at the actual loss per claim.
Insurance Loss Triangle Per Claim
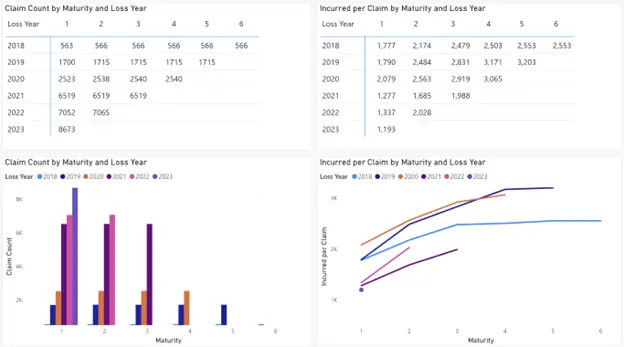
First, we need a claim count (top left). This is a basic count of claims, but it uncovers a very important issue. Sometimes losses occur but are not reported until a later date (IBNR; incurred but not reported). The claim count visuals expose this situation clearly. In 2020 we have 2,523 claims reported at the end of 2020 (maturity year 1), but we had 2,538 at the end of year 2. That’s an increase of 15 claims due to IBNR. Loss factors naturally take IBNR into account.
On the top right we have the total incurred per claim which simply divides the total incurred by the claim count for each loss year maturity cross section. Looking at the line chart on the bottom right we can visually see the increased incurred per claim as the claim matures. We could extend this analysis in many ways such as deriving a loss per policy, filtering to specific programs, or focusing on specific coverage.
How Loss Triangle Reports can Support your Business
Loss Triangles are a common tool used to help risk holders estimate how much loss will likely be incurred over the lifetime of a claim. This knowledge can be backed into rating equations such that new policies are priced accordingly. While this article covers the basics, there are many derivatives of loss triangles and their use. For example, it is common for carriers to use industry benchmarks in combination with actual loss trends, especially when there is not enough historical data available to build upon.
Hopefully, you found this helpful. Check out the interactive report linked below to explore a sample loss triangle report.