Most businesses don’t need more technology—they need better decisions. That’s why we created Data Stories: a series that shows how you can solve any problem in any industry when you turn to the data.
Each story explores a niche business challenge and demonstrates how a data-first mindset powers better decision-making, smarter problem-solving, and measurable results.
Because no matter the challenge or the industry, the answer is always in the data.
Grocery retailers operate in one of the most competitive and margin-sensitive sectors in the world, where small inefficiencies can lead to big losses. In this Data Story, we explore how grocery businesses can use tools like Power BI to improve product availability, optimize in-store experiences, and build long-term customer loyalty—one data-driven decision at a time.
Challenge: Maximizing Grocery Sales and Customer Retention
Grocery stores operate on tight margins, making product availability and consumer loyalty critical factors for profitability.
To stay competitive and profitable, retailers frequently grapple with decisions about which products to prioritize, how to arrange items to encourage impulse purchases, and how to time promotions for maximum effect. But without data-driven insights, storeowners are left relying on assumptions or incomplete information to guide inventory and marketing decisions, often leading to inefficiencies and lost sales.
These challenges often show up in ways that are easy to see—but hard to solve without data:
- Frequent stockouts of top-selling products
- Ineffective product bundling or promotions
- Poor timing for inventory restocking
- Limited understanding of customer reorder behaviors
- Missed opportunities for upselling and cross-selling
Why This Challenge Matters: Assumptions Lead to Missed Sales
Neglecting product availability and retention strategies is costly for grocery stores and has a direct, negative impact on customer satisfaction.
Without data to guide decision-making, retailers are left vulnerable to poor stocking decisions and mistimed promotions that can hurt margins and push customers away.
Stockouts, in particular, are one of the fastest ways to lose shoppers.
According to a survey of 9,000 consumers from the AlixPartners 2024 Consumer Sentiment Index, “two-thirds of consumers will leave an e-commerce site or store and shop from another retailer when an item they are looking to purchase is out of stock.” Another report from The Food Institute reveals North American food retailers lose 5.9% of their total sales due to stockouts.
Meanwhile, product placement plays a strong role in shoppers’ decisions. In a study on supermarket shopping choices, participants admitted “they made unintended food selections as a result of prominent placement.”
Bigger picture, assuming or misunderstanding customer purchasing habits can hinder demand forecasting accuracy and result in missed opportunities, negatively affecting both profitability and brand reputation.
All of this underscores the importance of proactive, data-driven solutions.
Solution: How to Find the Answer in the Data
A Power BI dashboard (or similar) can empower grocery stores to visualize trends, optimize inventory, and uncover hidden opportunities for growth within their transaction data.
Here’s how we can leverage business intelligence (BI) to help grocery retailers optimize sales and improve customer retention:
1. Identify Top-Selling and High-Reorder Products
Using historical sales and reorder data, we can surface patterns that help grocery retailers:
- Spot high-performing products based on sales volume and reorder frequency
- Align inventory with demand by identifying items customers are likely to purchase repeatedly
- Prevent stockouts by ensuring popular products are consistently available on shelves
- Boost customer satisfaction by consistently meeting expectations and maintaining product availability
- Drive consistent sales through smarter inventory decisions based on data insights
When you know what sells—and how often—it’s easier to stock strategically, satisfy customers, and avoid costly gaps in availability.
2. Analyze Order Patterns by Time and Day
BI dashboards can help you turn sales logs into actionable patterns. For example, one grocery dataset might reveal that:
- Higher shopping activity tends to occur on Sundays and Mondays
- Afternoon hours are the most active time of day
Recognizing these patterns enables retailers to align operations with demand so they can plan staffing, restocking, and promotions at the right time.
This kind of insight helps improve efficiency, reduce missed opportunities, and ensure customers always get the experience—and the products—they’re looking for.
3. Uncover Product Affinities and Bundling Opportunities
Market basket analysis is a technique that helps grocery retailers identify products frequently purchased together.
For example, your data may reveal that shoppers frequently buy bananas along with organic milk or strawberries.
These affinities do more than confirm buying patterns; they inform smarter bundling strategies that enhance the customer experience, encourage larger basket sizes, and increase revenue.
With data insights on co-purchases and customer flow, grocery retailers can take steps to optimize store layout and promotional offers, like:
- Bundling or placing complementary products near each other to drive impulse purchases
- Targeting cross-selling and upselling opportunities to boost revenue
- Designing store layouts to enhance convenience and improve the overall customer experience
When you act on these patterns, you make it easier for customers to spend more—without needing to be sold.
Dashboard Insights: Power BI for Grocery Retailers
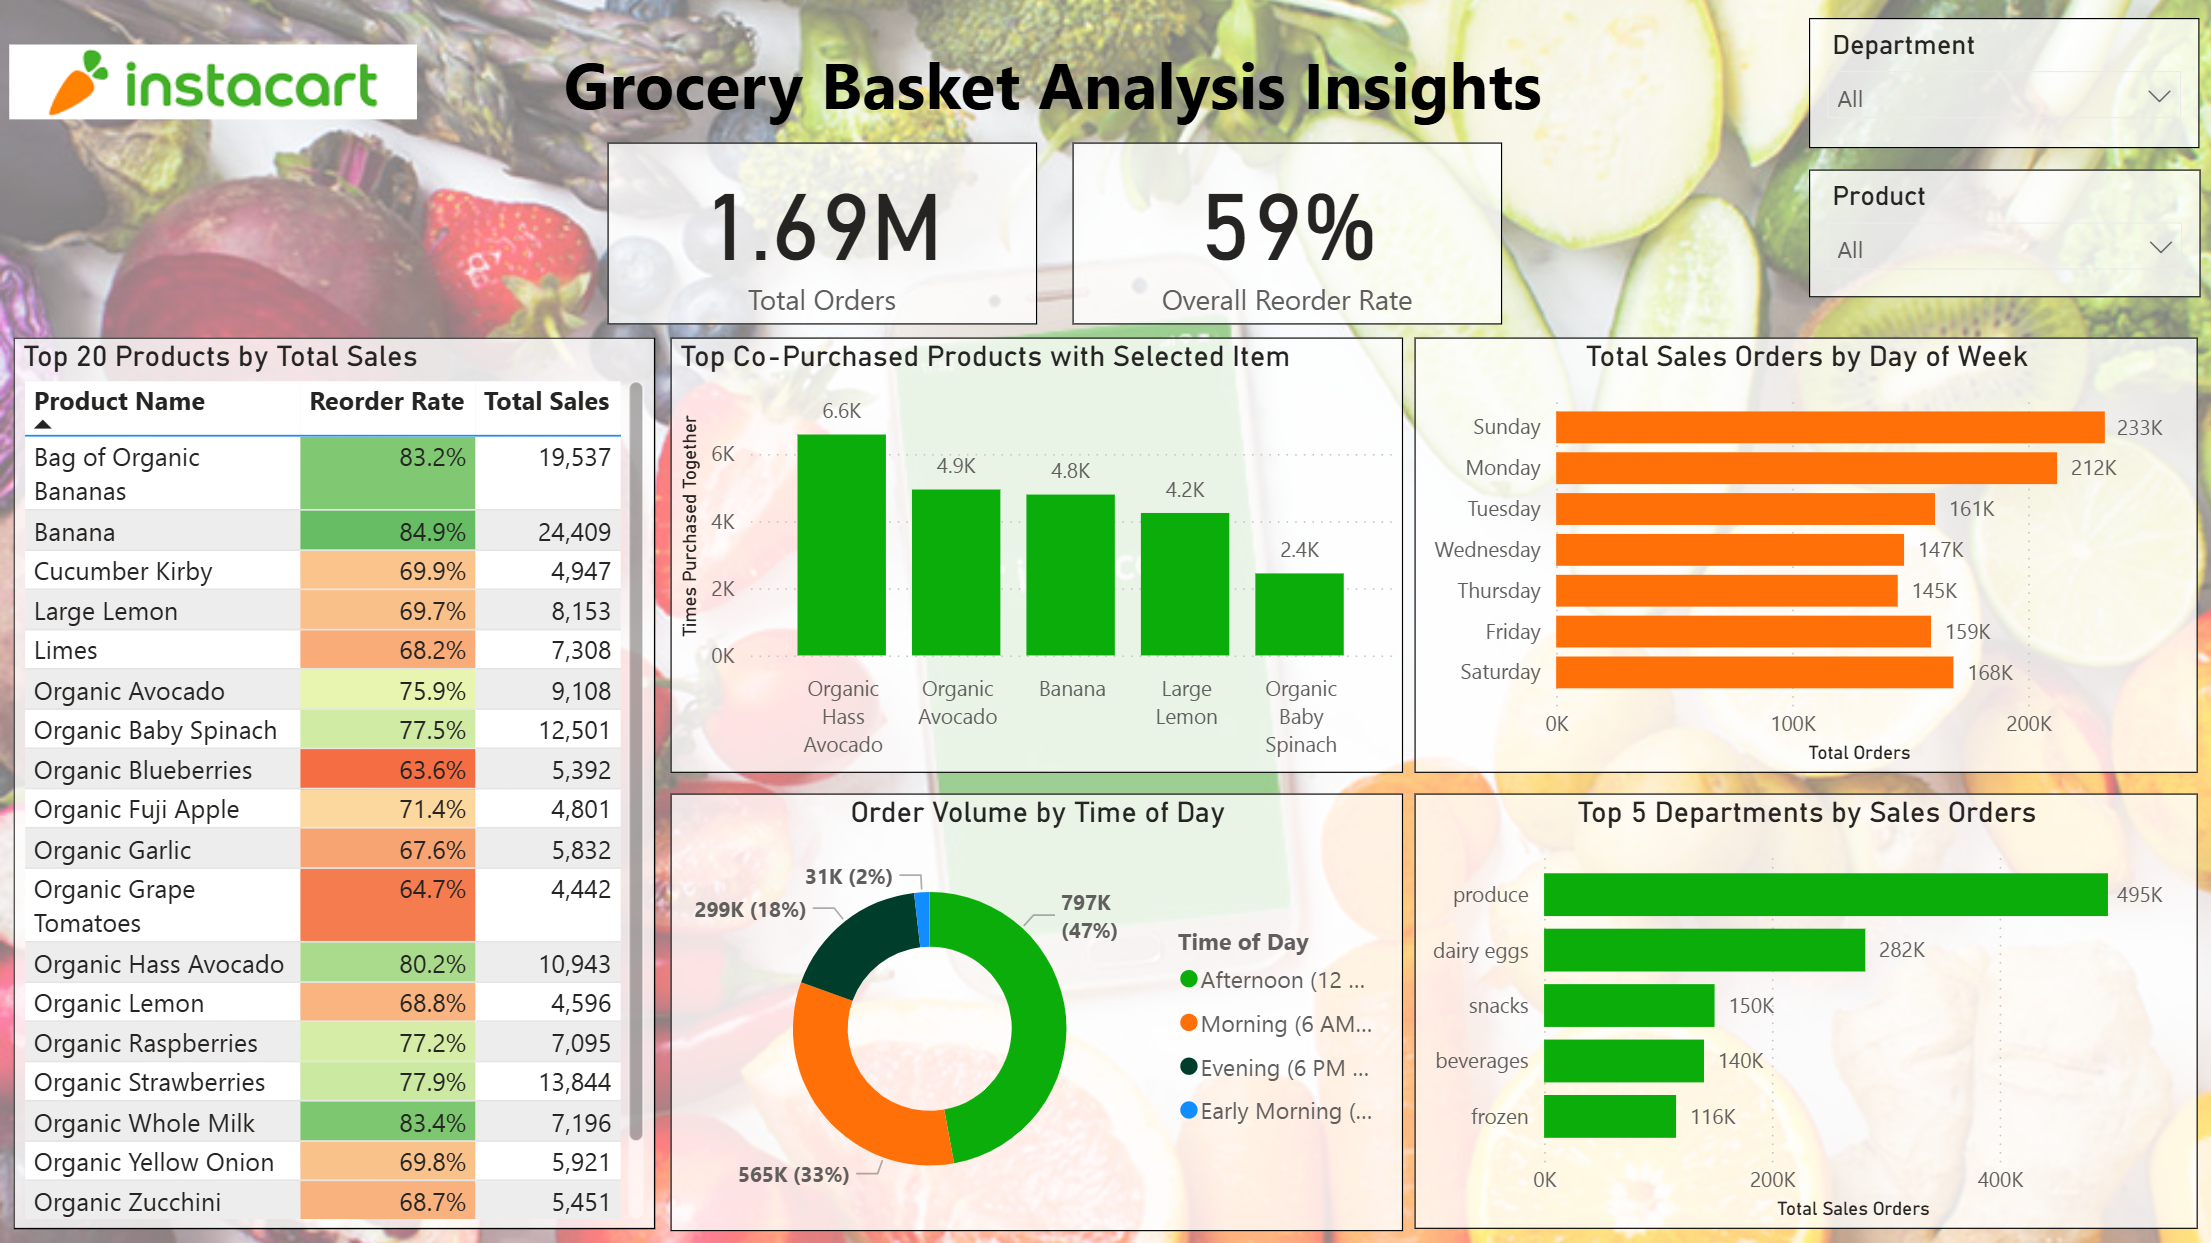
Using the Instacart Grocery Basket Analysis Dataset from Kaggle, which includes over 3 million orders from 200,000+ users, we explored shopping patterns based on product selection and cart behavior. This grocery store dashboard example highlights how data visualization can reveal patterns in customer behavior and product performance. Teams can track what matters most, from when people shop to what they buy and how products interact in the cart.
Grocery Basket Analysis Overview
This dashboard brings together detailed insights on product performance and purchasing trends to help grocery retailers better understand customer behavior and how it impacts sales. With a blend of visuals that reveal patterns across time and category, this dashboard supports both strategic planning and day-to-day operations.
Key insights include:
- Top products by reorder rate and total sales: Items like bananas, organic avocados, and organic milk appear frequently in customer baskets, making them essential for driving repeat purchases and customer loyalty.
- Total orders and reorder rate: A reorder rate of 59% reflects strong customer engagement, pointing to significant opportunities to build and strengthen long-term purchasing habits.
- Order volume by time of day: Nearly half of all purchases happen in the afternoon. Combined with day-of-the-week insights that show Sunday and Monday are the busiest days, this data can help teams optimize restocking, staffing, and promotional efforts around peak shopping windows.
- Top five departments by sales orders: Produce and dairy/eggs lead in volume, suggesting these categories are the most effective for bundling strategies and cross-category promotions.
- Interactive filters: With slicers, users can further interact with the dashboard, dialing into specific departments or products to focus analysis for more precise, data-informed decisions.
This dashboard is a good example of how a well-designed BI report can transform raw grocery sales data into a powerful decision-making tool. With real-time visibility into performance trends, you can act more quickly, reduce inefficiencies, and respond to customer demand with greater confidence.
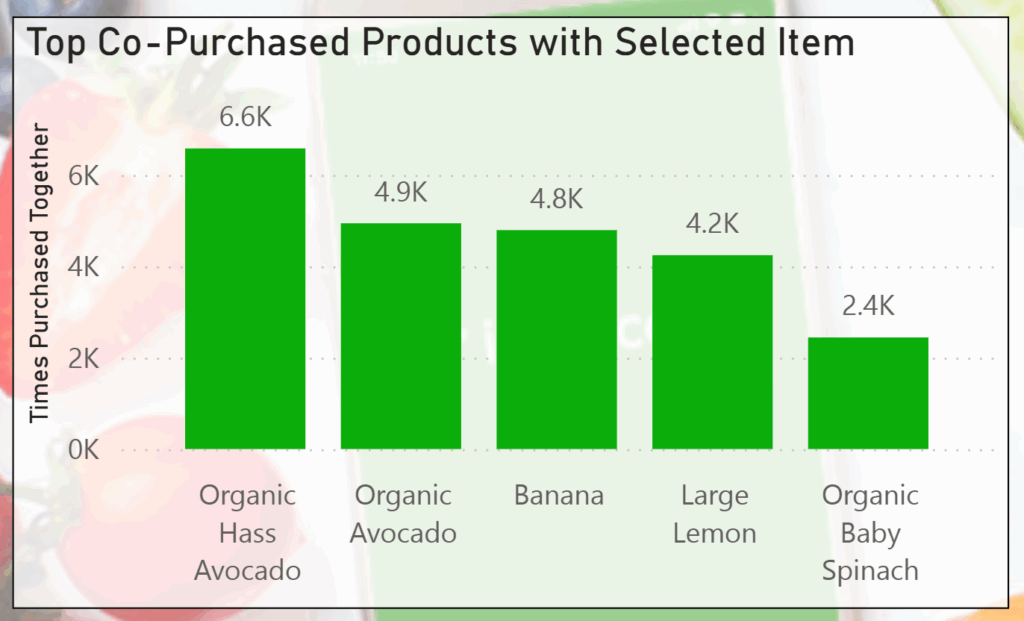
Top Co-Purchased Products with Selected Item
This visual focuses on co-purchase behavior, i.e., revealing which products are more commonly bought together with a selected item. Using historical transaction data, this chart highlights meaningful patterns in purchasing behavior that grocery retailers can use to inform bundling strategies and store layout decisions.
Let’s take a closer look at how it works:
- Co-occurrence analysis: identifies organic Hass avocados as most commonly bought alongside large lemons and organic garnet sweet potatoes, followed by items like cucumber kirby and organic half & half
- Co-purchase frequency: shows how many times each product was purchased alongside the selected item
What you can do with this information:
- Make informed cross-selling decisions by using co-purchase frequency metrics to guide bundling and promotions.
- Design smarter store layouts by placing high-affinity items near each other to encourage bigger baskets.
- Deliver personalized recommendations in digital platforms to promote repeat purchases and strengthen customer loyalty.
- Create a more intuitive shopping experience and more revenue opportunities by anticipating what customers want to buy together.
With this visual, you can turn basic purchase logs into a strategic asset, enabling both merchandising and marketing teams to move beyond general assumptions and make smarter decisions based on actual customer behavior.
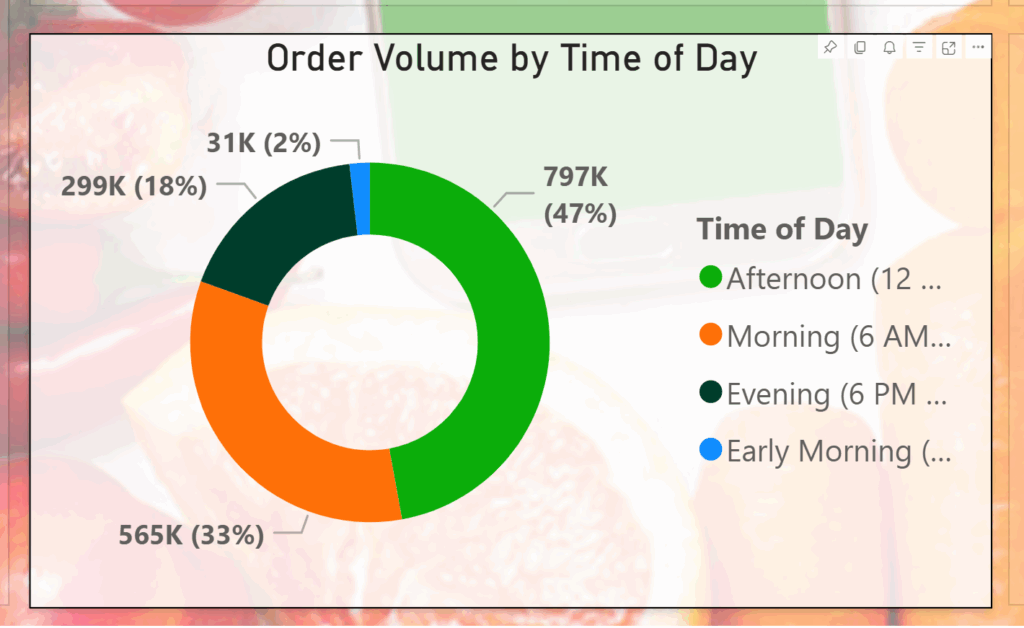
Order Volume by Day
This dashboard breaks down customer ordering behavior by time of day to reveal when shoppers are most active. In turn, retailers can use this data to align operational resources and marketing campaigns with actual customer behavior for improved efficiency and responsiveness.
In this example, the data shows that the afternoon accounts for nearly half of all orders, with 797,000 placed between noon and 6:00 PM. Morning hours follow at 33%, while evening and early morning orders make up a much smaller share.
These trends indicate that the bulk of customer activity happens during traditional daytime hours. With this information, retailers can:
- Support better decisions around staffing, system maintenance windows, and customer support coverage
- Time marketing and promotion strategies to align with high-traffic hours, e.g., sending targeted emails or app notifications around late morning to drive higher afternoon traffic
- Improve fulfillment planning by ensuring product availability and operational readiness during periods of peak activity
This simple but powerful visual translates timestamp data into clear guidance on when to act. It gives grocery retailers a real-time feel for customer rhythm, which can be used to improve both service delivery and business outcomes.
Curious how these trends would look at your retail store? View the interactive sample dashboard to explore the kinds of insights BI can surface.
Business Impact: Turn Grocery Data into Profit-Driving Decisions
With BI dashboards giving access to actionable insights like co-purchase trends, reorder frequency, and time-of-day patterns, grocery retailers can make faster, more informed decisions that directly improve operational efficiency and customer experience.
Here’s how:
- Identify top-selling and high-reorder products: Use data to reduce stockouts, streamline restocking processes, and ensure your most in-demand items are always available, minimizing missed sales and keeping customers happy.
- Analyze co-purchase trends: Build smarter in-store layouts and bundling strategies that increase basket sizes and boost average transaction values.
- Time-of-day analysis: Align staffing, inventory handling, and promotional efforts with actual shopping patterns to improve efficiency and better serve customer demand.
Together, these insights help reduce waste, improve forecasting, and sharpen your promotional timing.
On a broader scale, business intelligence empowers grocery retailers to move from reactive decisions to proactive strategies that strengthen customer loyalty, increase revenue, and deliver measurable ROI from every data-driven move.
Key Takeaways: Why the Answer Is in the Data
The examples highlight just a few of the ways data can reveal new opportunities to improve product availability and customer retention.
Your data holds answers, but only if you know where to look. With these principles, we can turn your data into strategic wins:
- What the data revealed isn’t obvious: Many retailers assume they know their best-selling or most frequently reordered items, but the data often tells a different story. For example, bananas and organic avocados were not only high in sales but also had some of the highest reorder rates, making them essential to keep in stock.
- Timing patterns change the game: When analyzing sales by time and day, we uncovered that the majority of orders occurred on Sunday and Monday afternoons. This insight allows retailers to better align restocking and promotional efforts with peak demand to reduce missed sales.
- Seeing patterns makes them actionable: Visualizing co-purchased product patterns makes it easy to identify effective bundling opportunities. By seeing which items are frequently bought together, you can get instant clarity into potential cross-selling strategies and store layout adjustments.
Every grocery retailer operates in a unique environment with different customers, products, and constraints. A one-size-fits-all approach won’t work—but a data-driven strategy empowers you to understand more, act faster, and grow stronger.
Explore Other Data Stories and Submit Your Industry:
Explore more LeapFrogBI Data Stories to see how other industries are solving problems with data:
Got a business challenge you’d like us to explore? Contact us to share your industry challenge, and we might feature it next.
Because no matter the industry, the answer is in the data.