Most businesses don’t need more technology—they need better decisions. That’s why we created Data Stories: a series that shows how you can solve any problem in any industry when you turn to the data.
Each story explores a niche business challenge and demonstrates how a data-driven mindset powers better decision-making, smarter problem-solving, and measurable results.
Because no matter the challenge or the industry, the answer is always in the data.
Bookstores often struggle with one key question: what to stock, and when? National bestseller lists don’t always reflect local tastes, and seasonal spikes—like summer reading or holiday gift-giving—can catch stores off guard. In this Data Story, we explore how tracking local sales trends, seasonal cycles, and best-selling themes can help bookstores make smarter inventory decisions, meet customer demand, and avoid missed sales opportunities.
Challenge: What Should a Bookstore Stock and When?
According to Publishers Weekly, the printed book format maintains over 50% of market share and had a modest increase in sales revenue in 2024.
That’s not to say digital or audiobook sales are slowing down. In fact, audiobook sales continue to grow year over year. Publishers Weekly reports “a revenue increase of nearly 80 percent since 2020” for audiobooks. Booksellers should consider tying their hardcopy offerings to audiobook trends. People love their books, and they love supporting in-person bookstores, just as much as physical booksellers love to share stories and encourage people of all ages to keep reading.
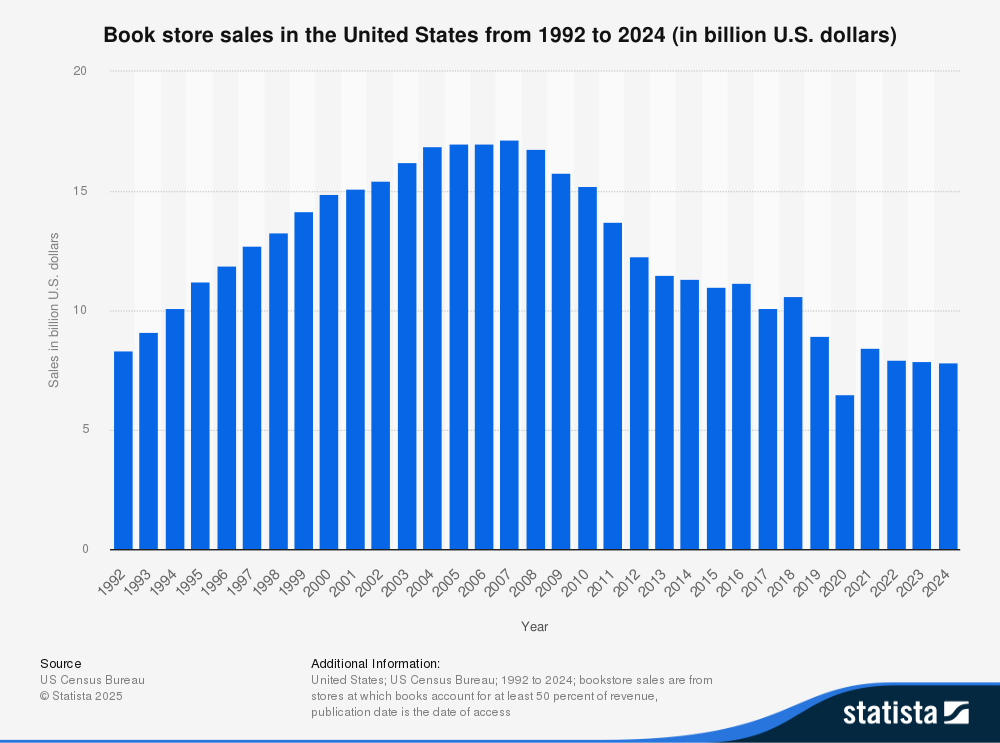
According to US Census data, as shown above from Statista, bookstore sales have been declining since 2008 and appear to be leveling out. Bookstores reported sales of $7.68B in 2024, a tad lower than the previous year. Printed books maintain over 50% of sales despite the rise of audiobooks. E-tailers are selling roughly half of the printed book format.
Brick and mortar stores can remain competitive by smartly using data for inventory and marketing decisions. According to From Whispers to Roars, an arts and literary magazine, both nationally and internationally:
- Highest-selling book type: paperback
- Highest-selling book category: fiction
- Highest-grossing book genre: romance
- Second-highest-grossing book genre: mystery/suspense
But the problem with these broad, high-level numbers is that they sweep everything into one heap without taking into account the details.
Consider: A bookstore in a busy, touristy city will likely fly through the latest paperbacks and beach reads, demanding an ever-rotating selection of books to keep up with the NYT Best Sellers list. But what about a bookstore in a small town with a high school nearby? They’re much more likely to focus on books like the classics, assigned literature, and study guides, especially when summer reading lists come out.
These are a few other common challenges that small bookstores face:
- National bestseller lists that don’t reflect local preferences
- Overstock of slow-moving titles leading to cluttered shelves
- Lost sales due to lack of timely stock
- Low profit margins squeezed further by discounting slow sellers
- Customers turning to online retailers after in-store disappointment
Knowing what to stock and when is important to keep your bookstore competitive, profitable, and connected to your readers.
Why This Challenge Matters: Stocking Without Insight Is a Risk
In an industry where margins are slim and shelf space is limited, stocking decisions carry real consequences. Local demand often tells a very different story than national trends, and ignoring that can lead to costly missteps.
When you miss the mark, the consequences add up:
- Best seller lists don’t take into account location or demographics: What could be a widely acclaimed book in the city may not catch on in a small town. If you rely too much on national trends, you may end up with stock that doesn’t resonate with your community.
- Buying too many books your clientele is uninterested in leads to inventory that lingers: These books may sit on the shelf for months, if not years, taking up valuable space. Plus, for smaller stores with little storage, this could make your space seem cluttered and cramped.
- Profit margins are already narrow when it comes to books: Slow-moving stock makes that even worse. A sale or discount might help clear out unsold titles, but it shrinks your margins even further.
- Disappointed customers often don’t come back: If your store doesn’t have what they want when they want it, they’ll look elsewhere—and that elsewhere often becomes their next go-to shop.
- Parents looking for required reading don’t want to wait: Disappointed parents who can’t find assigned books for their kids—especially during back-to-school season—may skip the special order, order online instead, and be less likely to return the next time they need something fast.
For independent bookstores with tight space and tight margins, every sale counts. Knowing what your customers want before they walk through the door is the key to staying viable in a competitive retail landscape.
Solution: How to Find the Answer in the Data
Your bookstore is probably already collecting the data you need. To make better stocking decisions, it’s just a matter of looking at it the right way.
Here’s how we can use data to help bookstores solve the problem of unpredictable demand:
Analyze Timelines and Trends
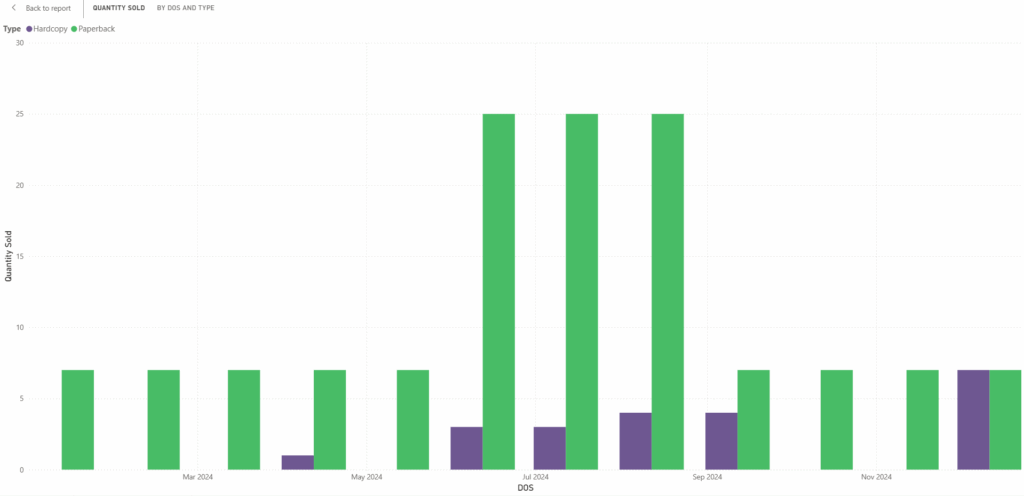
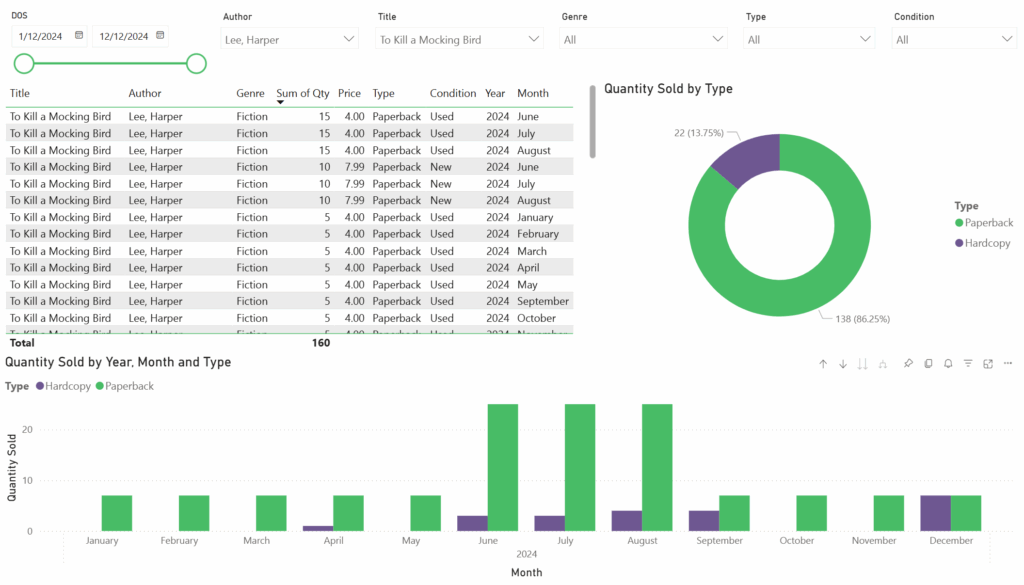
This trending graph from our sample dataset shows that certain books, like To Kill a Mockingbird, sell in far larger quantities over the summer than during the rest of the year.
It makes sense; summer is when school reading lists are sent out, causing dozens of students to search for the same book at the same time. Some classics are used year after year by English teachers, giving bookstores predictable cycles of when it’s time to stock up.
The same graph can be used to filter for the holiday months to show what types of books are most popular: fancy editions, like hardcovers or illustrated copies.
That matters: While it can be harder to move this pricier inventory during the rest of the year, you know that November and December will bring increased demand, and that you need to plan ahead for that seasonal uptick.
Bottom line: Look at seasonal patterns to help you stock smarter, reduce missed sales, and align your inventory with demand.
Track Best-Selling Authors and Book Themes
By tracking your store’s best-selling authors (either by books sold or by total revenue), you can better plan ahead to meet demand. On the second page of our sample report, you can view sales details by a top author to uncover trends and plan future events.
This information can help you make smarter marketing decisions, like:
- Promoting upcoming releases or author events
- Send timely newsletters or email alerts to customers to increase foot traffic and pre-orders
- Improve recommendations by identifying genres or themes that are quickly becoming more popular
Similarly, spotting trends in book themes can be helpful when picking out new releases to stock.
If your community is showing strong interest in a popular post-apocalyptic novel, curating a small collection of similar titles lets you offer personalized suggestions to keep the momentum going and give customers more reasons to return.
Bottom line: Track what’s already working to help you anticipate customer interests and align future inventory with proven demand.
Combine Local Trends with Industry Insights
While your bookstore’s needs are highly specific, national data can still be useful, especially when compared to your store’s performance.
To uncover meaningful insights, ask the right questions, like:
- Are national bestsellers moving slowly in your store?
- Are local preferences diverging from industry trends?
- Does your region have strong school or university-based buying cycles?
By pairing localized sales data with broader seasonal partners, you can gain context to make smarter inventory choices.
Sample Visualization: See the Data-Driven Mindset in Action
The following visualizations come from our Power BI interactive report created with sample data. They illustrate how visualizing local trends can lead to smarter stocking decisions.
Book Sales by Type, Genre, and Title
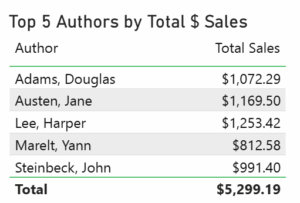
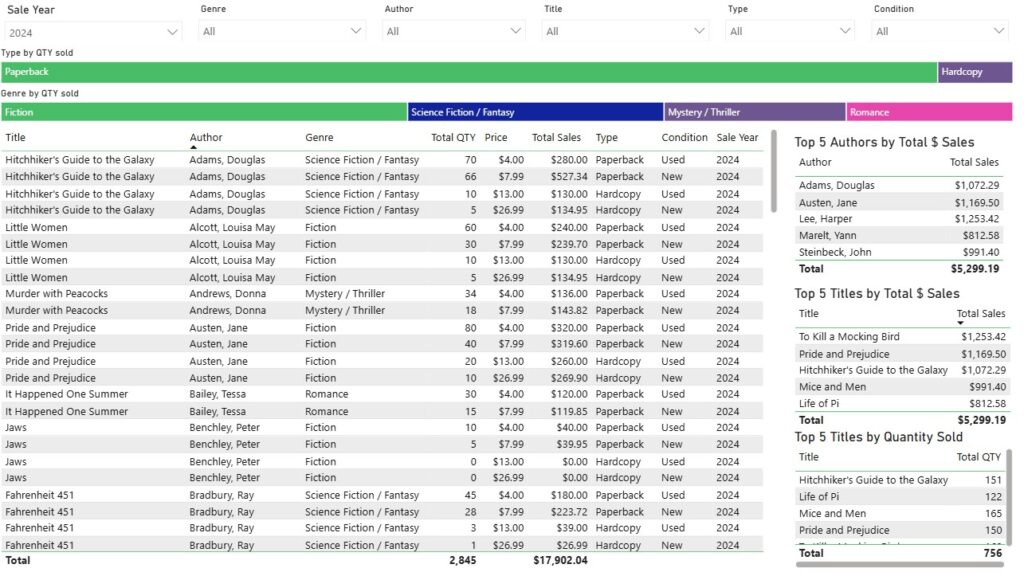
This example bookstore sales report uncovers key trends to help guide stocking, marketing, and promotional decisions. It breaks down sales by format, showing the performance of paperback vs. hardcopy editions. Books are also categorized by genre, making it easy to see which categories are most popular with customers. The first page of the report highlights the top 5 authors by sales revenue, the top 5 titles by sales, and the top 5 titles by quantity sold, offering a clear view of both high-value and high-volume performers. Together, these insights reveal where demand is strongest and which products are driving bookstore success.
Book Sales by Title and Type Over Time
To Kill a Mockingbird is consistently most popular in the summer months due to its inclusion on school reading lists. Accordingly, this graph from the second page of our report shows a dramatic sales increase in June and July—right on time with summer reading assignments.
This seasonal pattern can help bookstores plan for restocks ahead of time to meet demand, satisfy local students and parents, and avoid missed sales.
Curious how these trends would look at your bookstore? View the interactive sample dashboard to explore the kinds of insights BI can surface.
Business Impact: Turn Inventory Insights into Sales
With a data-driven mindset guiding purchasing decisions, bookstores can:
- Predict seasonal spikes in demand and prepare accordingly
- Cut down on unsold inventory and maximize floor space
- Target marketing around local reading trends and author events
- Improve profit margins by ordering smarter
- Offer a better in-store experience for loyal, local customers
Every book sold means another satisfied reader—and another step toward long-term profitability and sustainability.
Key Takeaways: Why the Answer Is in the Data
These examples highlight just a few of the ways data can help bookstores reduce inventory waste, improve customer loyalty, and make smarter stocking decisions.
Whether you’re a large retailer or small indie bookstore, your data holds answers—but only if you know where to look. With these principles, we can turn your data into strategic wins:
- Know your neighborhood, not just the nation: Romance novels and mystery books may be best sellers around the country, but that doesn’t mean it’s what your local readers want. Data helps you uncover unique patterns in your store, so you can stock what really sells.
- Timing is everything: Books that sell in the winter may be totally different than readers’ favorite summer picks. By planning for these seasonal trends, you can prevent stock from sitting around for months and keep your shelves dynamic and fresh.
- Data makes the invisible, visible: There’s no substitute for knowing what your unique bookstore needs. With a detailed look at your past sales and customer behavior, you can forecast better, market smarter, and sell more confidently.
Every bookstore is different. A one-size-fits-all approach can’t meet your needs—but a data-driven mindset ensures you’re ready to thrive in a constantly changing market.
Explore Other Data Stories and Submit Your Industry
Explore more LeapFrogBI Data Stories to see how other industries are solving problems with data:
Got a business challenge you’d like us to explore? Contact us to share your industry challenge and we might feature it next.
Because no matter the industry, the answer is in the data.

