Most businesses don’t need more technology—they need better decisions. That’s why we created Data Stories: a series that shows how you can solve any problem in any industry when you turn to the data.
Each story explores a niche business challenge and demonstrates how a data-driven mindset powers better decision-making, smarter problem-solving, and measurable results.
Because no matter the challenge or the industry, the answer is always in the data.
Restaurant owners know better than most that sales don’t always follow a steady curve. Seasonal spikes, unpredictable weather, and holiday crowds are among the biggest external factors that can send demand soaring—or tank it without warning.
In this Data Story, we explore how restaurant owners can use Business Intelligence (BI) to analyze historical performance data, weather trends, and holiday traffic to drive smarter decisions that improve planning, reduce waste, and maximize profits.
Challenge: Holidays and Volatile Weather Bring Unpredictable Sales Fluctuations
For restaurant leaders, even the most well-oiled operations can be thrown off when the sun shines too brightly or snow falls unexpectedly. Add holidays into the mix, and revenue becomes even harder to predict.
Without a clear view of these external factors, managers are left guessing about how many (and what) ingredients to order, how to schedule staff, and when to launch promotions.
And when leaders make decisions based off of guesses, the results are often costly, like:
- Overstocked perishable ingredients that spoil before they can be used
- Understaffed shifts that create long wait lines and unhappy customers
- Overstaffed shifts on slow nights that needlessly increase labor costs
- Marketing that misses the mark because no one saw the sales spike coming
As restaurant operators play the sometimes seemingly impossible game of satisfying customer demand while controlling costs, even small miscalculations can lead to waste and loss. And with average restaurant profit margins already as low as 3–5%, there’s not much room for error.
Why This Challenge Matters: Poor Forecasting Eats Away at Profits and Customer Loyalty
Whether driven by holidays or unpredictable weather, sudden swings in demand can be costly, disruptive, and difficult to manage.
For example, when restaurants over-order for what turns out to be a slow holiday, excess inventory goes to waste—and margins shrink. Conversely, when a typically slow shift experiences an unusual boom due to sunny weather, staff are overextended, service quality suffers, and the restaurant risks damaging its reputation due to long wait times and less-than-satisfactory guest experiences.
In both cases, the business suffers—and owners face operational efficiencies and reputational risks, such as:
- Wasted inventory and resulting food cost overruns
- Staffing imbalances that drive up labor costs and strain service teams
- Lost sales when customers walk out or opt for competitors
- Negative online reviews after poor service or stockouts
Without the ability to anticipate these fluctuations, restaurant leaders are left scrambling to react to unexpected traffic surges or slowdowns—losing money and risking long-term damage to their brand in the process.
Solution: How to Find the Answer in the Data
With a tailored BI report, restaurant leaders can stop guessing and start forecasting with confidence. By combining point-of-sale (POS) data with holiday calendars and historical weather feeds, restaurants can isolate the factors that drive demand—and use those insights to align staffing, ordering, and marketing promotions to actual patterns, not assumptions.
Here’s how we can use data to help restaurants manage unpredictable sales fluctuations more effectively:
1. Collect and Integrate Key Data Sources
To understand the factors influencing demand, we start by integrating internal sales data with relevant external variables.
- Aggregate daily sales by location, menu category, and time of day
- Pull holiday calendars and notable event dates into the dataset
- Ingest weather variables, such as temperature, precipitation, and alerts
- Ensure data cleanliness by standardizing date formats and filling gaps
2. Analyze Holiday Performance Patterns
By comparing historical holiday sales to typical weekday averages, we can determine which dates reliably affect foot traffic—and how.
- Compare holiday sales against baseline averages for the same weekday
- Identify which holidays drive above-average traffic (e.g., Mother’s Day)
- Flag holidays that historically see declines (e.g., Thanksgiving Day dine-in)
3. Model Weather-Driven Sales Fluctuations
Using advanced analytics, we can quantify how weather conditions influence customer behavior. From there, restaurant leaders can forecast traffic patterns to make data-backed decisions to adjust staffing, inventory, and marketing promotions for higher profitability and lower risk.
- Use regression or time-series models to correlate temperature swings with order volume
- Map precipitation intensity to foot traffic drop-offs
- Integrate promotions for weather-friendly menu items (e.g., cold drinks, outdoor specials)
By combining internal performance data with broader external signals, a BI dashboard enables restaurant leaders to anticipate demand more accurately, make more informed staffing and inventory decisions, and avoid costly missteps.
Sample Visualization: See the Data-Driven Mindset in Action
The sample data was artificially generated and represents four years of restaurant sales. Together, these visuals demonstrate how BI can surface actionable insights that restaurant leaders can use to better anticipate demand and make more strategic decisions to reduce waste, optimize staffing, and maximize revenue.
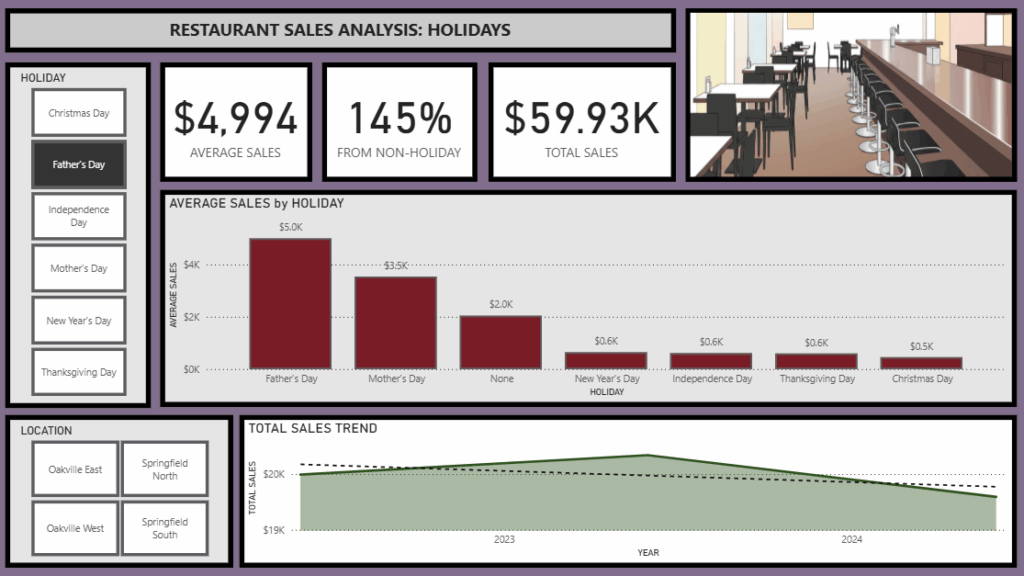
Father's Day Sales
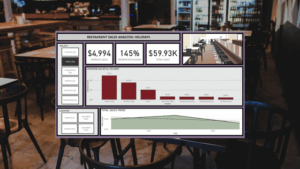
This visual compares actual sales to average daily sales. Notably, it highlights a sharp revenue spike on Father’s Day—145% above typical, non-holiday performance.
By identifying holiday-driven trends, restaurant leaders can better plan ahead for high-impact dates and ensure staffing, inventory, and promotions aligned with anticipated demand.
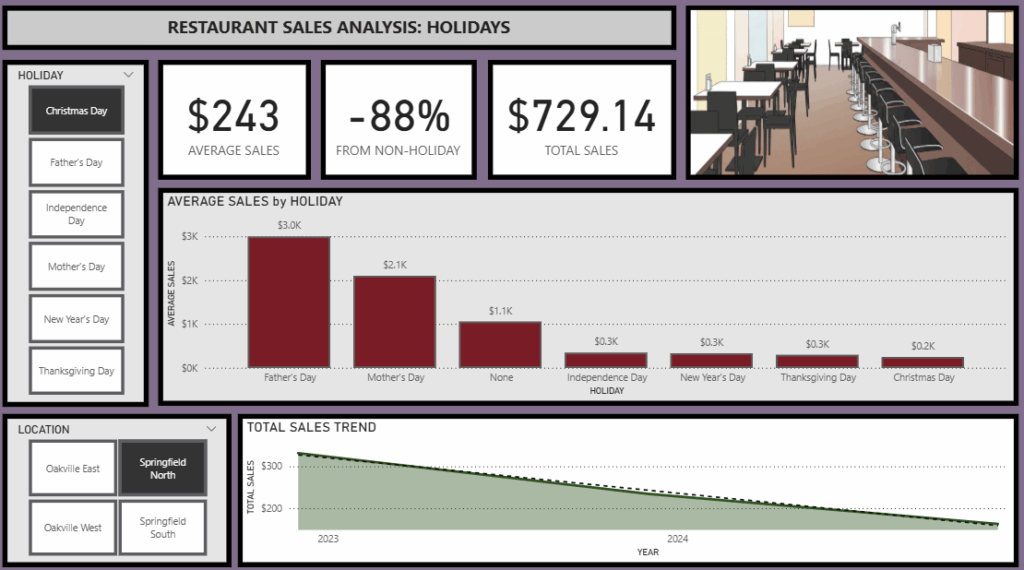
Christmas Day Sales
This visual shows that Christmas Day consistently underperforms compared to typical daily averages, coming in 88% below standard revenue.
With information about historically low-demand patterns, restaurant leaders can strategically scale back staffing and ordering to minimize waste and limit unnecessary labor costs.
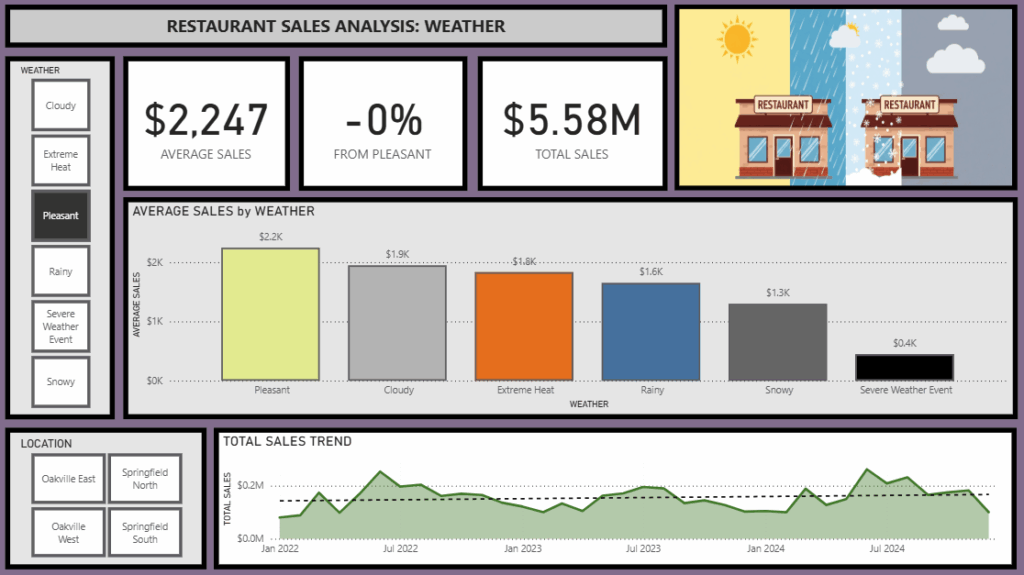
Sales During Pleasant Weather
This visual establishes a baseline for average sales on days with pleasant weather, creating a reference point to evaluate how more extreme weather conditions impact performance.
With a clearer understanding of what typical revenue looks like under ideal weather conditions, restaurant leaders can better quantify how much customer demand shifts when weather changes—and use that insight to plan staffing and inventory accordingly.
Sales During Extreme Heat
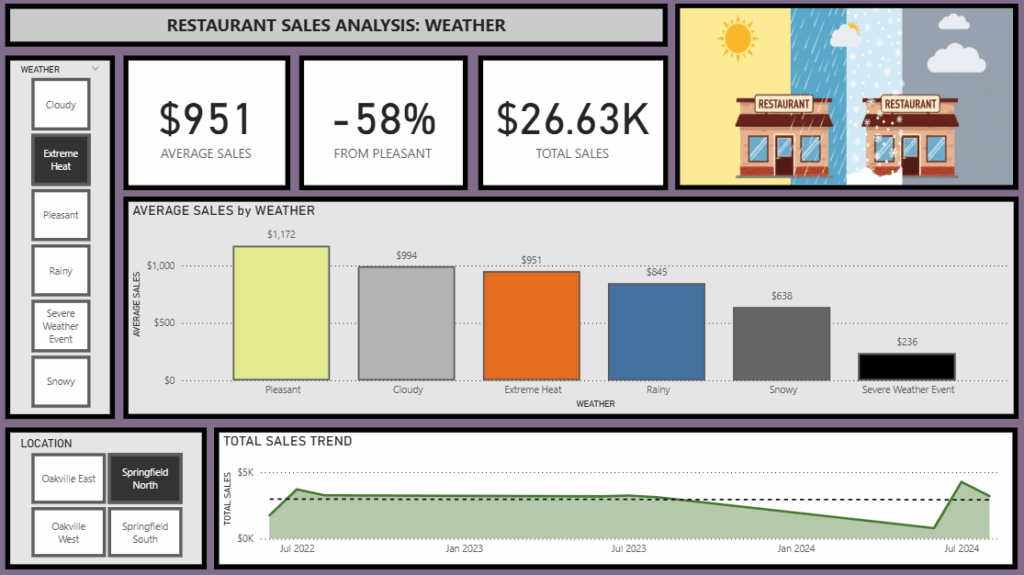
This visual shows how extreme heat has impacted revenue at the Springfield North location, showing a drop in sales by 58% compared to days with pleasant weather.
By using historical trends to isolate location-specific weather effects and performance shifts, restaurant leaders can pinpoint where, when, and how high temperatures impact customer turnout—and then adjust staffing and inventory strategies to reduce overages and protect margins.
Curious how these trends would look at your restaurant? View the interactive sample dashboard to explore the kinds of insights BI can surface.
Business Impact: Staying Profitable Even When Demand Is Unpredictable
With BI dashboards that incorporate historical holiday and weather trends, restaurant leaders can make more informed decisions that avoid unnecessary costs, improve customer experiences, and maximize profits.
Here’s how data translates insights into action:
- Reduce food waste: By aligning inventory ordering with forecasted demand, leaders can avoid overstocking perishable ingredients during slower-than-expected shifts.
- Control labor costs: To avoid costly overstaffing in times of low foot traffic, managers can adjust staff scheduling based on historical trends and weather forecasts.
- Optimize marketing promotions: With visibility into past sales patterns, leaders can time and tailor promotional offerings during high-impact holidays and favorable weather conditions that are most likely to maximize returns.
- Improve customer experiences: Data enables managers to better prepare for demand with adequate staffing and stock so long wait times and stockouts don’t compromise service quality.
Together, these actions empower restaurant leaders to act with strategic foresight—not panicked reaction—so they can plan smarter, serve better, and remain profitable, year-round.
Key Takeaways: Why the Answer Is in the Data
These examples highlight just a few of the ways data can empower restaurant leaders to uncover opportunities to improve inventory planning, optimize staff scheduling, and elevate customer experiences.
Your data holds answers to your business challenges—but only if you know where to look. With these principles, we can turn sales and even weather data into actionable insights that drive better decisions across the business:
- Holiday and weather trends are powerful forecasting tools: External events have a measurable impact on customer demand. By understanding these patterns and planning accordingly, restaurant leaders can better manage staff and stock —and avoid costly surprises.
- Mismatched planning drives unnecessary waste: When staff or inventory doesn’t reflect real-world demand, restaurants lose money in more ways than one, including food spoilage and overtime labor costs.
- Dashboards turn the unknown into insight: By visualizing the relationships between weather, holidays, and sales, restaurant leaders can move beyond guesswork to make more strategic decisions that reduce waste and protect margins.
Every restaurant faces different challenges, from location-specific weather volatility to shifting holiday traffic. But with a data-driven approach, leaders can anticipate demand and take proactive steps to stay profitable, year-round.
Explore Other Data Stories and Submit Your Industry
How to use data to:
- Improve OR Efficiency & Strengthen Hospital Financial Performance
- Rethink Car Accident Risk and Inform Smarter Safety Strategies
- Personalize Wine Club Memberships and Increase Profitability
Got a business challenge you’d like us to explore? Contact us to share your industry challenge, and we might feature it next.
Because no matter the industry, the answer is in the data.
