Report Description
This interactive Power BI report uses synthetic data generated by AI to simulate real-world insurance claim patterns. This ensures we use no personally identifiable information (PII), and create a safe repeatable testing scenario. It aims to illustrate the significance of meeting SLA Compliance, and reveal areas of improvement.
Audience: Insurance Agencies
Use Case
Claim delays can cause to lower SLA compliance and affect customer trust and satisfaction. A claims analysis report can be used to identify areas of improvement. Read our data story to learn more.
How to Use this Report
Across the top you can filter this report by:
- Open Date
- Close Date
- Adjuster
- Region
- Weather Condition
- Claim Type
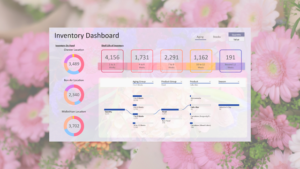
You see KPIs in blue boxes:
- Average Processing Days
- Average Customer Satisfaction
- % Closed within SLA
- Error Frequency %
- Resubmission Rate
On the right side is a “SLA Met” True/False button. Use these settings to peruse the 6 visuals on the report showing Adjusters Performance, Average Processing Days, Average Satisfaction Scores, SLA Compliance, Weather Conditions.