Coffee Shop KPI Dashboard: Essential Metrics for Growth
Report Description This interactive sample report uses data from a fictitious coffee shop chain, The Busy Bee, to show how raw metrics can be refined
Report Description This interactive sample report uses data from a fictitious coffee shop chain, The Busy Bee, to show how raw metrics can be refined

Most businesses don’t need more technology—they need better decisions. That’s why we created Data Stories: a series that shows how you can solve any problem
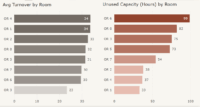
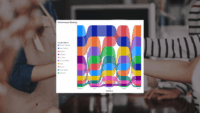
This Operating Room Efficiency Report can be used to monitor and improve Operating Room utilization for hospitals.

In this Data Story, we explore how hospital leaders can use data to identify inefficiencies in OR utilization, improve time management, and reduce hidden costs to ultimately make the most of every surgical minute.
One of the things we love most about Power BI is Microsoft’s commitment to the product, as demonstrated by its rapid development cycle. Every month,
Power BI Explained – Features for February 2020 One of the things we love most about Power BI is Microsoft’s commitment to the product, as
Power BI Explained – Features for November 2019 One of the things we love most about Power BI is Microsoft’s commitment to the product, as
Power BI Explained – Features for December 2019 One of the things we love most about Power BI is Microsoft’s commitment to the product, as
Power BI Explained – Features for October 2019 One of the things we love most about Power BI is Microsoft’s commitment to the product, as
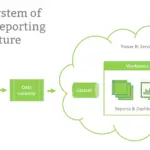
When developing a reporting solution there are a variety of possible solution architectures to choose from. The available architectures range in complexity and purpose, and