
Use the Right Tool for the Job
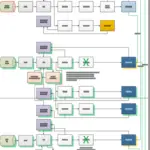
Building a data mart can be broken down into three distinct steps. Extact data from source system Transform data to desired structure Load data into
Building a data mart can be broken down into three distinct steps. Extact data from source system Transform data to desired structure Load data into
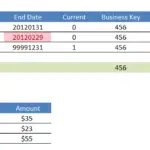
When building a dimensional model it is critical that facts have accurate foreign keys pointing back to related dimensions. However, there are some situations where
Users can now add custom scripts to components. For example, add indexes or update statistics using t-sql scripts. Built components will include the provided custom
One of the foundation concepts that all database workers should keep in the back (or maybe front) of their mind is ACID. This small and
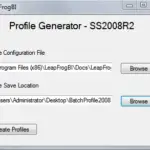
LeapFrogBI is a SaaS metadata driven ETL platform. At no time does LeapFrogBI connect directly to either the source or the destination systems. Therefore, the first
The new f9001 component automates deletion of records from a fact table. Simply select the fact table to effect and a source to inner join
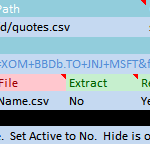
There is a wealth of data available via REST API much of which is publicly available. LeapFrogBI simplifies and automates the process of extracting data from
I get asked on occasion to quantify the efficiency that the LeapFrogBI data warehouse automation platform offers. Below are a few measures that were collected
It probably goes without saying that BI and data warehouse projects can be very complex. Taking a bottom up & agile approach breaks the larger

The Multi-File Stage s9600 template provides a simple method to stage many files with the same structure. The following steps describe how to setup this component.