How well healthcare practices managed claim denials could mean the difference between a bottom-line profit or loss. This article will walk you through three steps proven to reduce your claim denials. Take a look at the video below for an overview.
3 KEY QUESTIONS TO HELP REDUCE CLAIM DENIALS
How do I learn my denial rates?
Step 1 - Get the facts
What exactly is your denial management situation? Are denial rates improving or getting worse? What type of denials are costing your practice the most revenue? The first step toward reducing the impact of denials is to get the facts. Start with the top 4 Denial Management KPIs:
- Denial Count (how many claims were denied)
- Denial Amount (billed amount on denied claims)
- Denial Rate as percent of revenue (denied amount / total billed amount)
- Denial Rate as percent of volume (denial count / total claim count)
HFMA has done an outstanding job of documenting how to calculate denial rate KPIs. If you want to dive into the details, check out these articles (external links):
- Standardizing denial metrics for revenue cycle benchmarking and process improvement
- HFMA MAP Keys (required free membership)
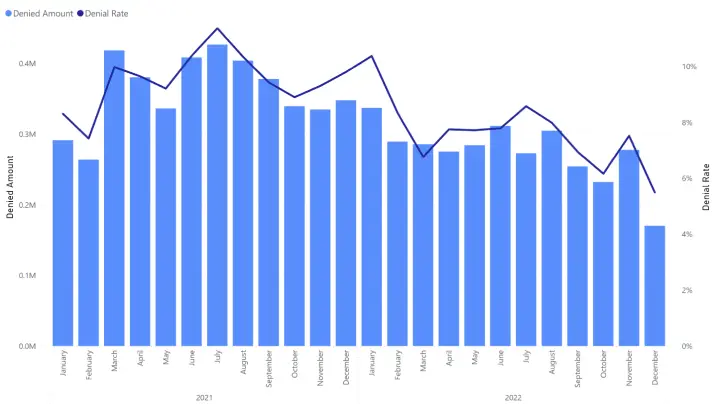
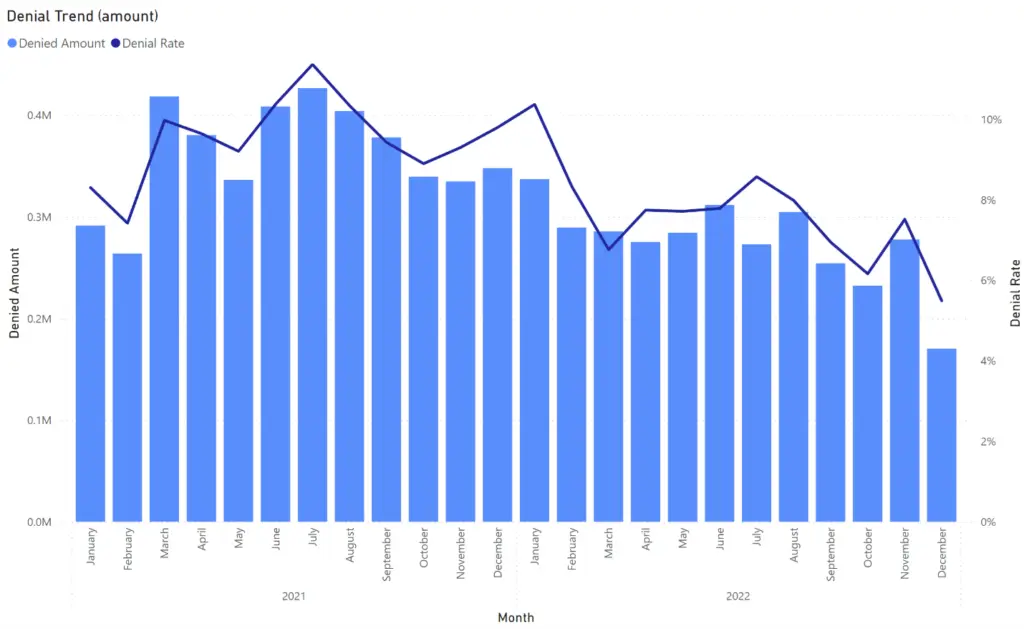
It is easy to fall into the analysis paralysis trap. Try to keep it simple. For example, below is an example of a simple combo chart that relays key information while also being easy to consume. The viewer can quickly see that the trend is going in the right direction, but there is still a lot of opportunity for improvement.
In addition to high level summary reports, we also need to enable analysis by key dimensions such as:
- Date of Service
- Service Location
- Denial Code & Category
- Payer & Financial Class
- Service Item; CPT and Categories
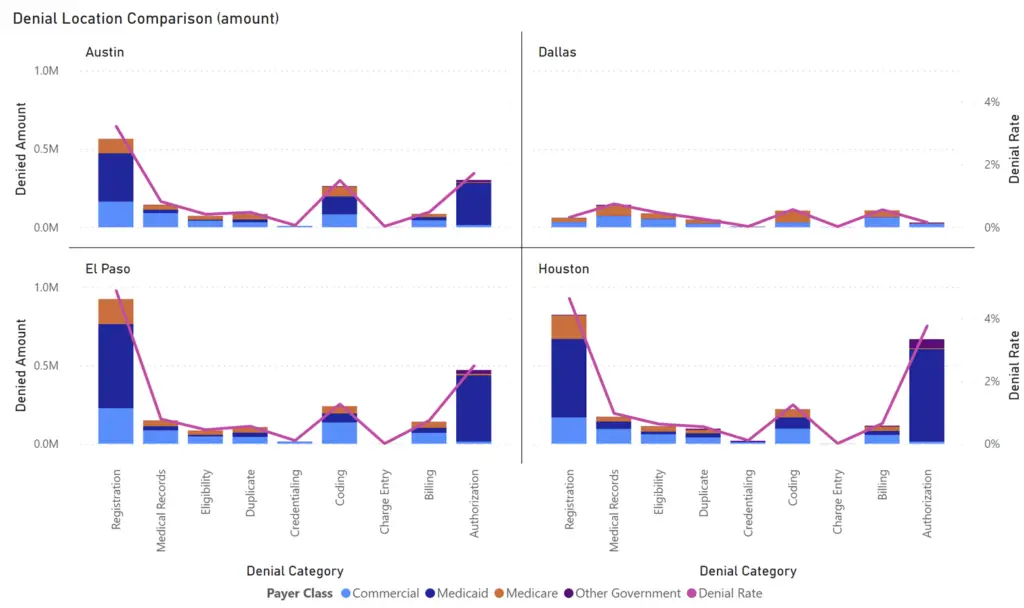
The above example shows how we can quickly learn something by doing a little slicing & dicing.
- Dallas is looking a lot better than other cities.
- Registration & Authorization denial categories are key problem areas.
- Medicaid is associated with the overwhelming majority of denials.
How do I analyze my denial rates?
Step 2 - Find the worst offenders
Now that you have a clear understanding of what is going on in your business, it is time to identify the worst offenders. You likely will want to prioritize denials that are costing you the most money first. How do we identify these worst offending denials? Simply use a matrix visual to sort denial KPIs by the key dimensions.
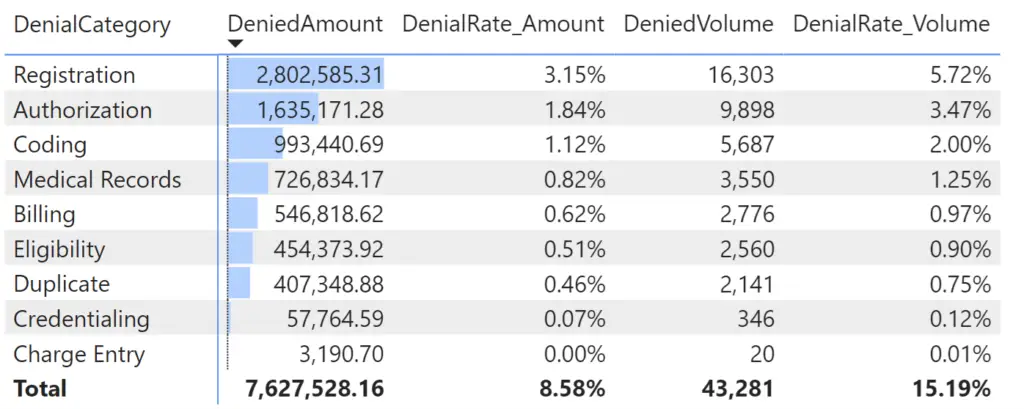
In our example above, we can quickly see that Registration & Authorization are the two most impactful denial categories. But which payer is associated with these denials? Is this consistent across all locations? What about CPTs; do all associated CPTs have the same issue? You get the point. We need to drill down and find the combination of factors that pinpoints the worst offenders.
Consider the below report page. We have denial KPIs broken down by each of our key dimensions in separate matrixes. To make life easy on ourselves, we sorted each visual by Denied Amount and added a bar representing the relative amount for each member.
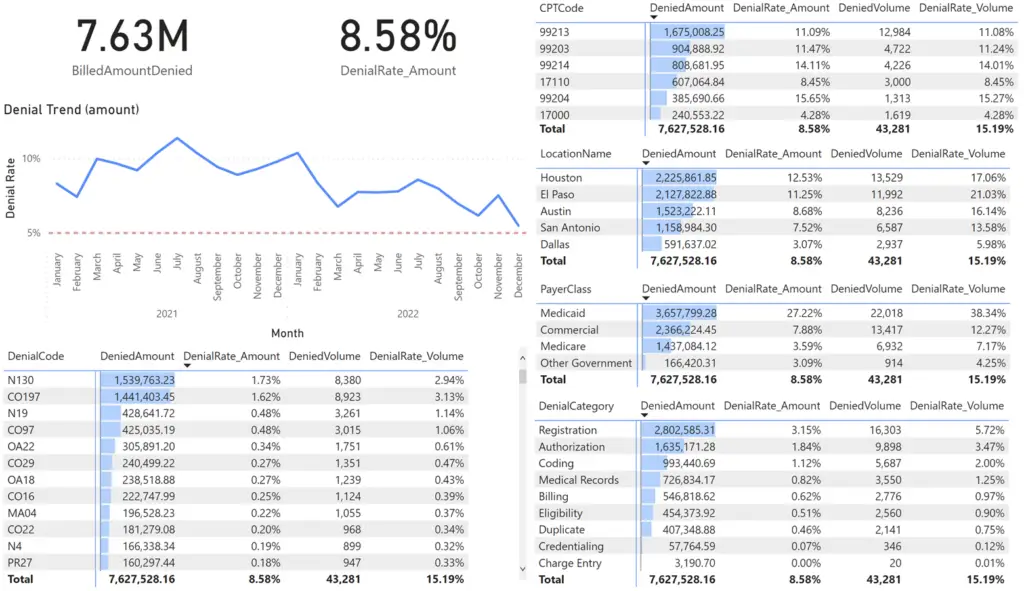
This type of simple layout is very useful for revenue cycle managers as it enables exploratory analysis. The key is that all visuals interact with one another such that when one record is selected, all other visual filter to the selected value.
The first thing that pops out to me is the 27% denial rate for Medicaid claims. I want to focus on that problem, so I select Medicaid.
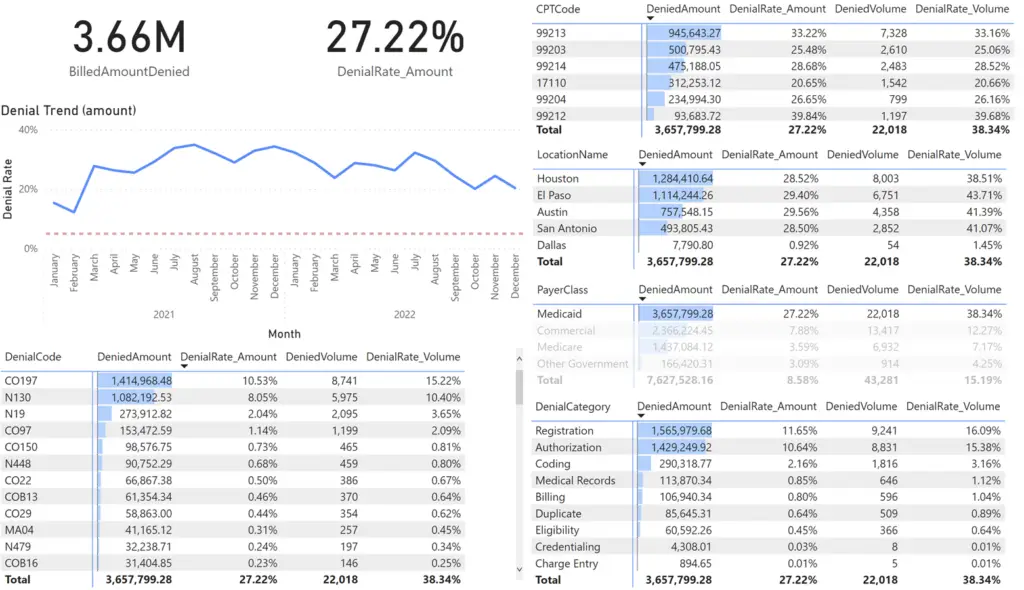
All other visuals are filtered to Medicaid Payor denied claims which represents over 3.6M in denials. We can simply continue on this path of selecting the worst offenders until we have some insight into the costliest problems.
How do I reduce claim denials?
Step 3 - Devise a plan and take action
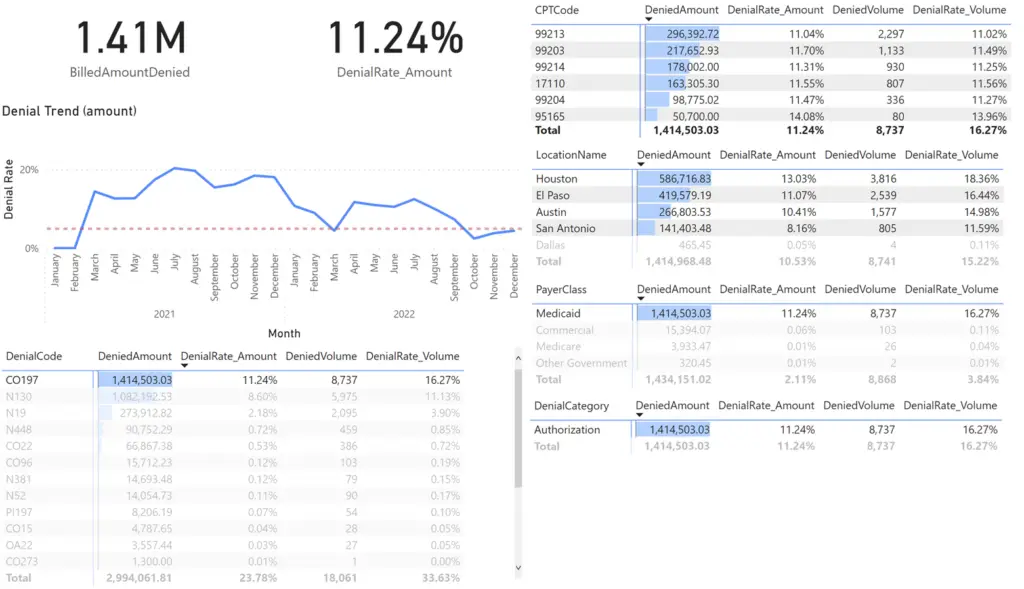
We know the numbers and we know the worst offenders. It’s now time to start digging into the business processes responsible for this problem. We have the clues we need to isolate this issue. In our example, we know that we need to focus on the authorization business process. Your results will differ, but the approach stays the same. Find the biggest offender, then learn everything you can about the business processes involved with the problem.
Tip – Pay attention not only to the worst offenders but also to the best cases. In our example, Dallas does not have the problem with Authorization that the other cities have. Why? Perhaps there is a different business process in place that can be extended to the cities that are not performing as well.
With denial KPIs in hand and the failed business process identified, we can make an informed decision as to how to fix the situation. We also have the information needed to persuade leadership to support our decision. Hey CFO, this problem has cost us 1.4M in lost revenue, and I know how to fix it. Interested?
Take Action! You know what to do and leadership supports you. Get all stakeholders up to speed. Make sure everyone from individual contributors to upper management knows what their role is. Sometimes a simple business process change can make a world of difference. Also, be sure to let everyone know how you are measuring success (share those reports).
Pro Tip! Never stop doing steps 1 through 3.
Contracts change, human resources change, and new problems will arise. This is a continuously evolving process; that is why agile reporting is so critical. You must stay on top of denial management every single day. Business intelligence is a business function, not a project. The good news is you now have a systematic and efficient approach to improved denial management.
Explore our Interactive Claim Denial Report
Other resources you might find useful:
7 Steps to Reduce Claims Denial Rates in Your Medical Practice (adsc.com)
Success in Proactive Denials Management and Prevention (hfma.org)
Claims Denials: A Step-by-Step Approach to Resolution (ahima.org)
6 keys to addressing denials in your medical practice’s revenue cycle (mgma.com)