
County Building Opportunity in California Report
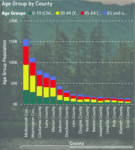
Report Description This interactive report uses county‑level development and demographic data in California to show how basic metrics—permits, population trends, and opportunity scores—can be turned
Report Description This interactive report uses county‑level development and demographic data in California to show how basic metrics—permits, population trends, and opportunity scores—can be turned

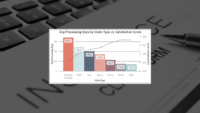
Report Description This interactive sample report uses data from a fictitious coffee shop chain, The Busy Bee, to show how raw metrics can be refined
Report Description This interactive Power BI report uses synthetic data generated by AI to simulate real-world insurance claim patterns. This ensures we use no personally
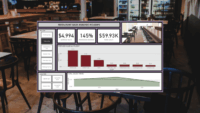
Report Description This is an interactive two-page Power BI sales report for the restaurant industry. Audience: Restaurant owners and managers. Use Case This report can

This Power BI report visualizes credentialing and compliance trends using sample data modeled after real-world expiration rules and continuing education (CE) requirements. It provides a centralized view of credential status, compliance risk, and upcoming renewal needs.
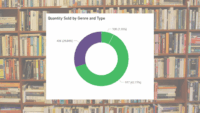
This report focuses on bookstore sales. It highlights book formats, genres, top authors, best-selling titles, and overall sales trends.

This report shows how grocery stores can track what matters most, from when people shop to what they buy and how products interact in the cart.
This report explores how demographic data can guide Oregon organizations in improving recruitment strategies, aligning job offerings with community needs, and making more informed, locally relevant decisions.
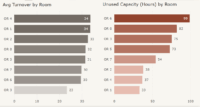
This Operating Room Efficiency Report can be used to monitor and improve Operating Room utilization for hospitals.
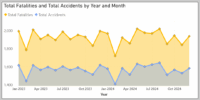
This report explores how business intelligence tools can uncover surprising patterns in traffic fatality data using FARS. It reveals how data-driven insights can help insurers, policymakers, and safety experts focus on real risks and rethink safety strategies that save lives.