Report Description
Industry: Healthcare
Audience: Revenue Cycle Managers, Business Managers, Financial Managers
Use Case
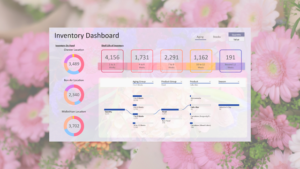
This is an example of how billing and claim denials data can be integrated into a unified view of the organization’s cash trends.
Constant monitoring of the metrics displayed on this dashboard helps the office of Finance take timely action and pre-empt any potential financial constraints.
Which location carries the largest receivable balance? – Select a location and look for unusual relations between receivable volume and collections in that location when compared to the total and to other individual locations.
Which payers hold the most receivables? – Click on any payer and see how the metrics vary for that selected member.
Which locations and payers carry the most past-due balances? – Select the 90 day aging bucket and verify how that impacts the location and the payer charts.
How To Use This Report
Hover
You can hover over many chart elements, like a bar in a bar chart, to reveal additional details.
Filter by clicking chart elements
All of the charts on a page can also act as filters for each other. For example, click a dimension, like a location, a payor or an aging bucket, and all related charts will update automatically. To clear the filter, click the same dimension again.