Report Description
This Power BI report explores how business intelligence tools can uncover surprising patterns in traffic fatality data using FARS (Fatality Analysis Reporting System). It reveals how data-driven insights can help insurers, policymakers, and safety experts focus on real risks and rethink safety strategies that save lives.
Audience: Car Insurance Professionals, Policymakers, Public Safety Officials, or Traffic Safety Analysts
Use Case
This report shows how traffic fatality data can be put to work in the following ways:
Support Fairer Risk Assessments
Uncover key risk factors like road conditions and driver behavior
Build more accurate and equitable risk models
Guide Targeted Prevention Strategies
Map accident patterns by time, location, and cause
Focus safety efforts where they’ll have real impact
Surface Opportunities for Product Innovation
Spot emerging driving trends and behaviors
Inspire new coverage options and smarter incentives
Streamline Claims and Internal Processes
Use data patterns to anticipate claims and speed up resolution
Improve efficiency during high-stress situations
Read the Data Story here.
How to Use This Report
Use the top filters to explore accidents involving speeding and/or alcohol
Focus your analysis by selecting a specific state
Drill down by time of year to see when fatal accidents peak
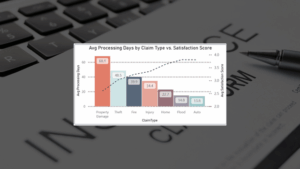
In the bottom left, filter by specific accident types
The bottom right visual shows accident patterns by light and weather conditions