Report Description
- Industry: Healthcare
- Audience: Office of Finance, RCM, Upper Management
Use Case
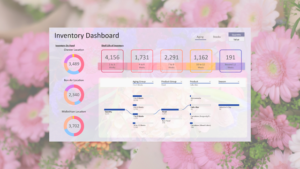
This Power BI report breaks down charge lag key metrics: Lag days, amount and percentage. It also displays those by location, procedure and payer.
Across the organization, what are the worst offenders? – Metrics are displayed sorted by the lag amount in descending order. A few locations, procedures and payers concentrate most of the lag impact.
What are metrics trending in time ? – Note that in general the trend is positive and lags are lowering.
How To Use This Report
- Hover
You can hover over many chart elements, like a line or a columns, to reveal additional details.
- Filter by clicking chart elements
All of the charts on a page can also act as filters for each other. For example, click a dimension, like a location, a payor or an aging bucket, and all related charts will update automatically. To clear the filter, click the same dimension again.
- Move to Page 2
Click on to the second page of the report to see claim volume information.