Report Description
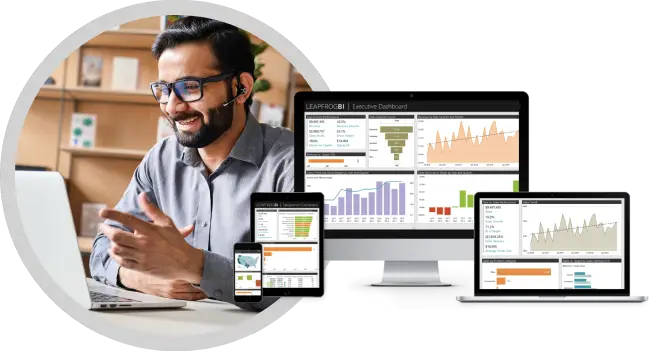
This is an interactive two-page Power BI sales report for the restaurant industry.
Audience: Restaurant owners and managers.
Use Case
This report can be used to uncover trends in restaurant sales tied to holidays and weather. Increase revenue by making better staffing and inventory decisions. Other local events or market trends could be added to this analysis.
Read the data story here.
How to Use This Report
Page 1 – Filter by holiday and location on the left side.
- The bar chart in the center shows average sales by holiday.
- Explore sales trend over time at the bottom.
Page 2 – Filter by weather and location on the left side.
- See the average sales by weather bar chart in the center of the report.
- Explore the sales trend over time on the bottom visual.


