Sales Dashboard and Reports (Sample Data)
Report Description
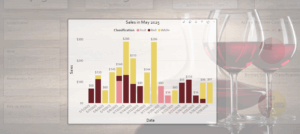
This is a live dashboard you can interact with and explore. It illustrates how data can be organized for different stakeholders, and how one visual can be used to filter data in other visuals on the same page.
How to use this dashboard
Navigate
This example sales dashboard is organized by stakeholders into pages. You can flip through pages using the arrows at the bottom. The following pages are available:
Executive
Sales
Sales Territory
Salesperson
Hover
You can hover over many chart elements, like a bar in a bar chart, to reveal additional details.
Filter by using filters
If a page has a filter located in the upper right you can set the parameters to filter the results of all charts on the page.
Filter by clicking chart elements
All of the charts on a page can also act as filters on each other. Click a dimension, like a line name or risk state, for example, and all of the related charts will update automatically. To clear the filter click the same dimension again, or click “reset filters” in the upper right corner.
Drill down into a hierarchy
Some data, like dates, can be organized into a hierarchy with levels. When data is structured this way you can drill up and down through the hierarchy with ease. With a date hierarchy, for example, you might be able to change the view from year to month to day. When drill down is supported you will see arrows appear in the upper right of the chart as you hover it.
Drill through to a detail report
Some charts are linked to detail reports that allow you to see the underlying records being summarized in the chart. When a chart is linked to a detail report you will see a “Drill Through” option when you right click it.