Introduction
In the past, companies bought reporting software, such as Cognos or Business Objects, hoping to solve their reporting challenges with a single purchase. More recently, companies started buying newer tools like Power BI and Tableau with similar expectations.
Despite the considerable power of these tools, there is no easy fix to the complex challenges of enterprise reporting, and companies expecting one should reset their expectations. Whether you’re considering such a purchase, or have already made one, there are some important decisions you’ll need to make that go along with it, and some core concepts you should understand. In the end, your level of business intelligence success or failure will largely be determined by factors other than your choice of reporting software.
The Importance of Reporting Tools
Let’s start with the obvious question. Is it necessary to purchase some reporting tool to enable high-performance reporting and fact-based decision-making in your company?
The answer to this question is a resounding yes. Reporting applications are extremely powerful and have a very important role to play in any business intelligence solution. And while this has been true for decades, lately we’ve seen the ease-of-use and flexibility of reporting software improve dramatically while prices have remained flat, or even decreased.
At a minimum, reporting software should be used to explore data and create visualizations that effectively communicate the story the data is telling and reveal important insights. There is no better tool for the job. In most cases reporting software is also the logical choice for report distribution and consumption, and to enable threshold-triggered and exception reporting and notifications.
In short, these tools have an important role to play, and there has never been a better time to buy or subscribe to one.
Are Reporting Tools Enough?
While the need for reporting software is well-established and commonly understood, their ideal role in the larger picture of enabling business intelligence is often less clear.
In our practice, we commonly encounter companies of all sizes that have purchased one or more reporting applications yet still struggle with reporting. Despite their tremendous power and functionality, these tools alone are typically not sufficient to enable these companies to generate meaningful and accurate reports.
Often this outcome has less to do with the capabilities of the software than it does the way they are being used. While reporting software is excellent for reporting, it can’t easily solve the age-old problem of “garbage in, garbage out.”
Unfortunately, data coming out of transactional and back-office applications almost always requires some degree of modification before it can be used in reports. In its natural state, data is rarely “report-ready.”
Despite the best efforts of the leading software developers in the space, it remains very difficult to solve this challenge. Reporting tools may include features that can assist with this work, but no tool of any kind can yet solve this problem entirely.
Can reporting software alone be used to achieve enterprise reporting success? Perhaps, but companies that purchase reporting software without a clear understanding of the need for data preparation, and some idea of the resources required to accomplish it, are in for a surprise.
The Need for Data Preparation
Most executives and managers readily understand that reporting is difficult because data isn’t perfect. But most in business lack a clear understanding of the specific data issues that cause this difficulty and wonder why it’s so hard to overcome them.
The following are a few of the most common data challenges, the problems they cause, and the remedies that should be applied in any business intelligence solution:
Common Data Challenges Resolved by Business Intelligence Data Solutions
Data Challenge | Description | Impact | Solution |
Normalized Data | Enterprise software applications are designed to store large volumes of data and support small changes to individual records as quickly as possible.
They almost always utilize a “highly normalized” data structure, breaking information into a large number of small tables designed to minimize data duplication. | Reporting queries often require a large amount of data at once. When querying normalized databases this means joining many tables which requires complex logic that can be difficult to write, debug and maintain.
Typical reporting queries also run slowly on normalized databases which can cause performance issues for operational system users. | To overcome this challenge, business intelligence solutions often employ a more flattened, or “denormalized” data structure. When well designed, reporting data models mimic the way business users view the data. These models have the potential to greatly reduce the complexity of reporting queries while eliminating the performance burden on operational systems altogether. |
Missing Data | The data entered by employees into enterprise software systems may be missing values that describe activity or define relationships between entities. It may also be missing information that needs to be derived. | Missing values result in inaccurate reports which can lead to incorrect decisions.
Without derived data and the insights it reveals, companies miss opportunities to improve strategy, efficiency, and ultimately profitability.
| When missing data can’t be resolved in the operational system, BI systems employ business rules to infer values, or assign an “unknown” value to maintain referential integrity, ensuring no values are excluded from analysis. They also provide an optimal place to store derived data. |
Invalid or Irrelevant Data | The data entered into enterprise software systems may contain inaccuracies due to human error.
Additionally, when systems are modified, upgraded or replaced it may result in data that is no longer valid or meaningful in its natural state. | Bad data must be removed one way or another. This requires tools, technical skills and a detailed understanding of how the data relates to business processes. Without an automated solution, this need places a resource strain on the organization as it struggles to generate accurate reporting. | One hallmark of robust business intelligence systems is their ability to automate the process of data transformation, correcting and filtering data as it is ingested. This is typically accomplished using custom code that is developed in conjunction with business stakeholders and SMEs. |
Historical Data | Historical data may periodically be archived so that it is no longer available in the original data structure, or becomes unavailable altogether. | Poor access to historical data limits the range and effectiveness of trend reporting and period-over-period reporting, leaving the business without critical KPIs needed for effective management. | To avoid the negative impact of missing historical data BI systems often include an initial load process that handles all historical data, along with a data persistence mechanism that insulates report development from source data availability. |
Disparate Data | Reporting usually requires data from multiple enterprise applications. While different applications may have some data in common, they use different data structures and may have different representations of the same data elements. | Often it is impossible, or nearly so, for IT departments and business people to adequately integrate data from multiple systems for reporting. When this effort is undertaken manually it becomes a time-consuming, repetitive resource drain and often produces errors that impact report quality. | By combining a careful analysis of the data with an understanding of what it means and how it is used by the business, solution architects can design and automate data processing rules that correctly and consistently integrate disparate data sources and produce detailed exception reporting to notify the business of data quality issues as they appear. |
Companies that wish to succeed with reporting and analytics must understand these issues and take a deliberate, careful approach to addressing them. Unfortunately, most still lack the expertise and tools that go into developing an enterprise business intelligence solution. Looking for an easy way out, they employ a combination of SQL database queries and Excel heroics to achieve some level of reporting success, never overcoming the significant shortcomings of this more casual approach.
"Our Software Does It All"
Companies that wish to move beyond the limitations of manual data preparation using SQL and Excel face a confusing journey. The business intelligence field is notoriously complex and comprises a large number of software providers all claiming their tool will magically transform data into reports.
Let’s return to the question we so often hear:
Can I point [reporting tool] directly at my data and use it to generate reports, or do I need to prepare my data first, then load it?
If we listen to the companies offering reporting software the answer is a “yes”. According to one leading vendor you can “Connect to data on prem or in the cloud—whether it’s big data, a SQL database, a spreadsheet, or cloud apps like Google Analytics and Salesforce. Access and combine disparate data without writing code. Power users can pivot, split, and manage metadata to optimize data sources.”
What they’re claiming is that you can simply point the tool at your source data and start generating reports with a few clicks. And if you have to do more extensive data transformation, then they support that too. You can use the tool to integrate, cleanse and organize data however necessary to make it easy on the end-user to develop reports.
The proposed approach looks like this:
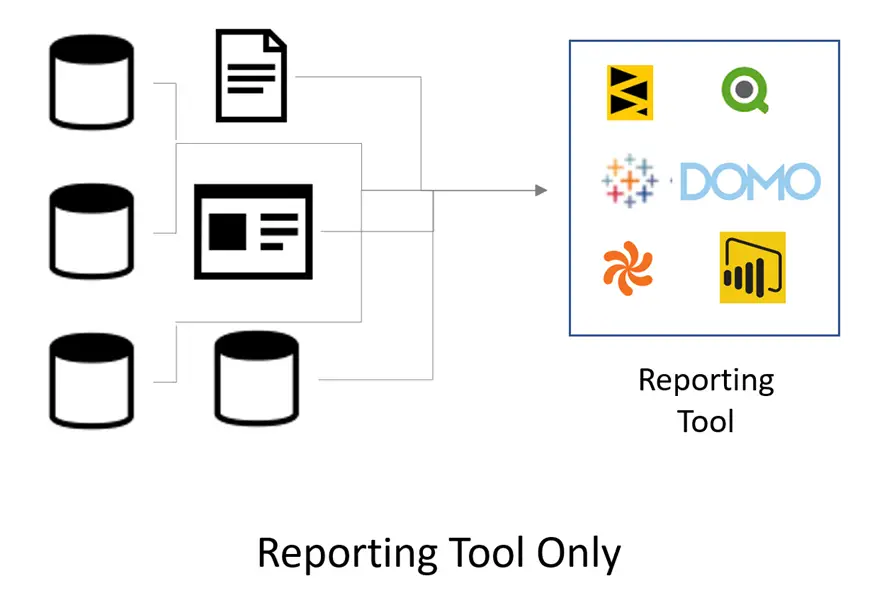
In theory, this can work. It’s entirely possible to point your reporting software at the source system database, and you can do a remarkable amount of data transformation right in the tool. Often you can use it to integrate, cleanse and organize data in a way that makes report development easy for typical business users.
It’s easy to believe that a single tool can solve your reporting challenges, given that most companies are able to solve a large majority of those same issues using just Excel.
Unfortunately, the reality may look more like this:
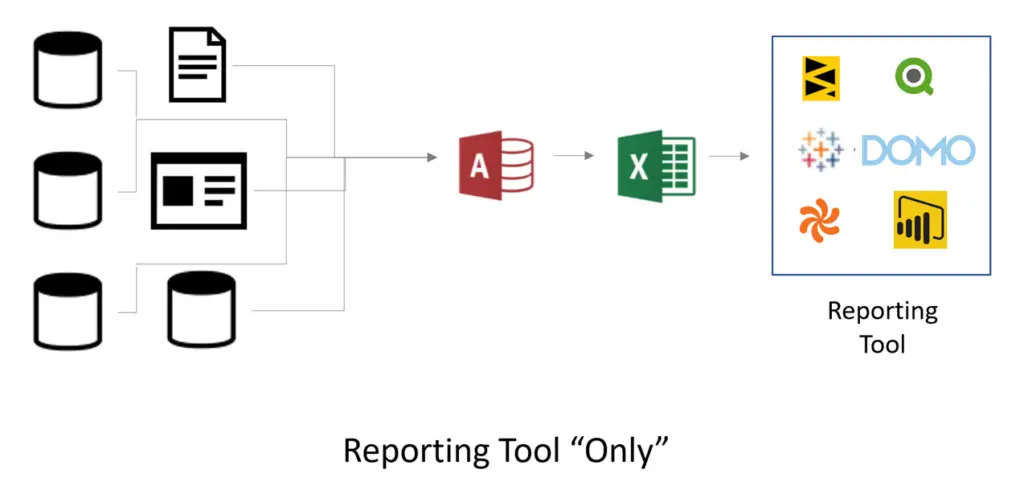
Most companies have difficulty eliminating dependency on Excel when implementing a single-tool solution. Individual departments and business analysts already have expertise in Excel. They typically also have historical data stored in Excel that may not be available anywhere else. Further, they probably have macros and formulas in spreadsheets that already perform significant data transformation. So, when given the option to leverage all of that, or try to recreate it starting from scratch, many opt to leverage Excel as part of the overall solution. In fact, we’re told the most predominant data source feeding Tableau today is Excel.
An Alternative Approach - Data Solutions
Despite improvements in reporting software over the past several decades, companies have routinely struggled to achieve success with business intelligence. The need to prepare data and the challenge of accomplishing this goal within a reporting tool demands new approaches.
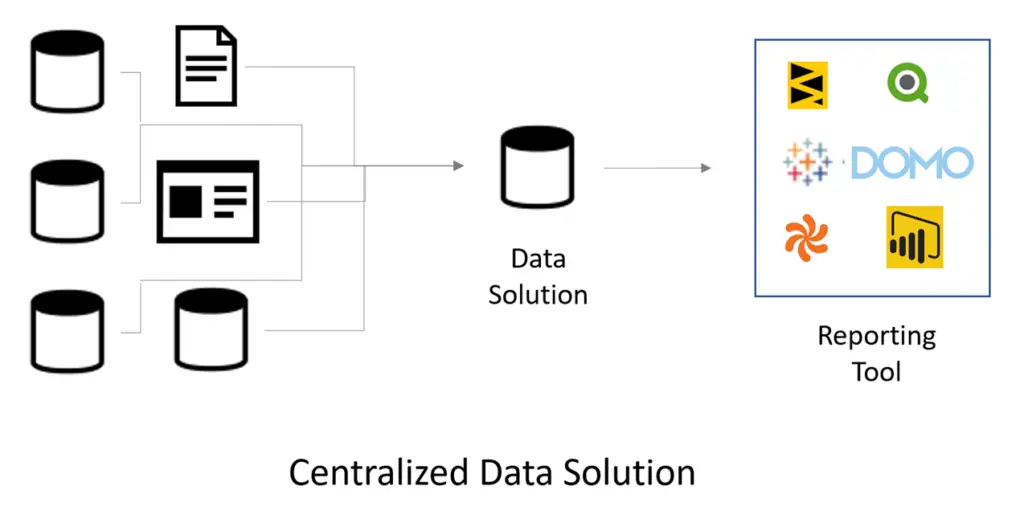
The prevailing methodology has been to separate data preparation and data consumption into two environments. The defining feature of this approach is a custom, purpose-built series of data preparation algorithms we like to refer to, collectively, as a “data solution.” Data solutions can take many forms, from a persistent staging area to a dimensionally-modelled data warehouse and semantic layer. Regardless of the selected architecture, or the tools used to create it, data solutions all do one thing – they provide a central repository of report-ready data that can be consumed by any reporting tool, and is easily understood and manipulated by business users, regardless of what tool they use to access it.
The proposed approach looks like this:
Choosing the Best Approach for Your Company
Depending on your perspective, one or the other of these two approaches may seem like the obvious winner. Some would argue that a single tool approach is clearly superior because it allows companies to avoid the effort and expense of a large, technically challenging data warehouse project. Others might argue that these projects are justified because in the long run they provide companies with superior results.
We believe the best approach is the one that meets the requirements of your company as efficiently as possible. While we often we recommend our clients develop a centralized data solution, we believe a single tool solution can work well in limited situations.
The following diagram lists the key considerations when evaluating a centralized versus a decentralized approach to data preparation for business intelligence.
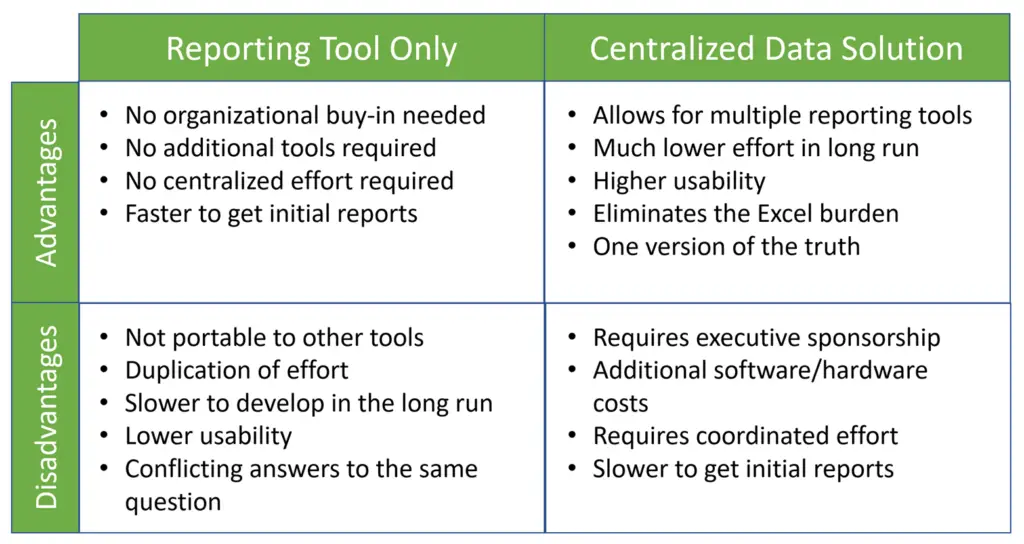
Let’s briefly examine the pros and cons of each approach:
Reporting Tool Only
The tool-only approach can accurately be described as fast. You simply purchase some software licenses, get some training and start developing reports. In the right hands, this approach can yield high quality reports and dashboards in as little as a few weeks, or even days.
Companies on a tight budget or just starting out with analytics will benefit tremendously from the power of a modern reporting tool. They will also avoid all the headaches associated with the centralized approach – most challenging among them the need to align the entire organization, including senior management, around the effort.
Of course, the appeal of this approach can quickly fade. The disadvantages, which may not be readily apparent at first, quickly come into focus as they place additional strains on the organization and frustrate efforts to develop a mature enterprise reporting capability.
In addition to the fact that it often doesn’t eliminate the use of spreadsheets, the biggest problem with the decentralized, tool-only approach is that work happens in silos. Each department or user may develop their own data preparation algorithms, thus producing a unique data set. Not only is this a duplication of effort, but it frequently results in conflicting views of the same data, and different answers to the same business questions. This lack of shared confidence in data is debilitating for companies looking to coordinate strategy and streamline operations across departments.
Centralized Data Solution
Where the decentralized approach to data preparation struggles, the centralized approach shows its strengths. By de-coupling data preparation from reporting, the centralized approach offers serious advantages.
One obvious advantage is the ability to “build once and deploy many.” In other words, the algorithms and logic used for data preparation can be developed just once, with no duplication of effort, and all parts of the organization can leverage the resulting data set.
Other benefits include higher data quality, higher data usability and greatly reduced data management overhead. But the most important advantage afforded by centralized data preparation is a “single version of the truth.” With a single, governed data set, built by and utilized by everyone, arguments about whose data is “right” become a distant memory. This in turn promotes company-wide cooperation around performance improvement in a way the siloed approach can’t.
Companies choosing to develop a centralized data solution must be prepared to make additional investment of both time and money. Additionally, they must gain buy-in from across the organization in order to succeed. Fortunately, this effort will be well repaid with the creation of a company-wide culture of fact-based decision making and performance optimization, and the success that comes with it.