Most businesses don’t need more technology—they need better decisions. That’s why we created Data Stories: a series that shows how you can solve any problem in any industry when you turn to the data.
Each story explores a niche business challenge and demonstrates how a data-driven mindset powers better decision-making, smarter problem-solving, and measurable results.
Because no matter the challenge or the industry, the answer is always in the data.
Insurance is a trust-driven industry where service delays can erode customer relationships and brand reputation. Even slightly below-target SLA compliance can leave policyholders feeling frustrated and undervalued. In this Data Story, we explore how insurance companies can use Business Intelligence (BI) and data analytics to identify the root cause of SLA underperformance, improve claims handling, and increase customer satisfaction. To illustrate this, data generated by AI is used to simulate real-world insurance claim patterns.
Challenge: What Factors Impact SLA Compliance?
SLA (service-level agreement) compliance is a critical measure of operational performance in the insurance industry. Simply put, it reveals whether or not a claim has been resolved within the timeline promised to the customer.
Various factors can contribute to low SLA compliance (and the subsequent decline in customer satisfaction scores), including:
- Delayed claim-processing time
- Resubmission rates
- Error frequency
- Claim types
- Weather conditions during the incident
Without data-driven analysis, determining which factor has the biggest impact on SLA compliance (and customer satisfaction) trust can be a challenge for insurance companies.
Why This Challenge Matters: SLA Compliance Directly Impacts Customer Trust
In this example, the insurance company has an average SLA compliance rate of 70%—below their target benchmark of 80%. But this isn’t unusual among insurance companies. Many adjusters and claim types fall short of SLA targets. When they do, customers are left waiting for resolution—and become increasingly dissatisfied with the process.
Customers’ irritation is understandable. Car accidents, property damage, and theft are already frustrating experiences. Often, that frustration compounds when people file a claim with their insurance company—a process that can feel just as stressful and time-consuming as the loss itself.
When processing claims becomes a source of frustration, customer trust quickly deteriorates. Our sample report shows that for every additional day a claim remains open:
- Customer satisfaction drops significantly (correlation: -0.76)
- SLA compliance decreases further
To protect customer trust and retention, insurance companies must identify the factors impacting SLA compliance so they can improve their claims-handling process.
Solution: How to Find the Answer in the Data
A Power BI report can help insurance leaders analyze claims processing patterns to uncover inefficiencies, highlight improvement opportunities, and prioritize targeted actions to improve SLA compliance—and ultimately customer trust and satisfaction.
By looking to the data, we can identify which operational areas have the most room for improvement and how leaders can use these insights to make decisions that streamline processes, reduce delays, and improve satisfaction.
Here’s a closer look at how we get there:
1. Pinpoint Underperforming Adjusters
Using top vs bottom SLA metrics, we can closely examine customer satisfaction scores, error and resubmission rates, and average SLA compliance. This allows managers to quickly see who is excelling, who is struggling, and where training or process changes can make the biggest impact on performance.
2. Identify High-Delay Claim Types and Weather Conditions
With average processing days broken down by claim type and weather conditions, we can compare patterns to identify standouts and determine which factors are most heavily impacting SLA performance. In turn, this information helps insurance leaders make decisions to prioritize improvements and allocate resources effectively.
3. Visualize Correlations and Model Impact
Interactive BI visualizations enable us to clearly see the relationships between processing time, errors, and customer satisfaction. From there, we can model what happens to SLA compliance when teams reduce errors and/or shorten process delays. These simulations give leaders concrete, measurable goals to guide improvement efforts.
By transforming raw claims data into actionable insights, BI empowers insurance companies to take targeted, data-driven steps to improve SLA compliance and strengthen customer trust.
Sample Visualization: See the Data-Driven Mindset in Action
The following visualizations come from our Claims Analysis Report which includes claim types, SLA performance, customer satisfaction scores, processing times, and weather conditions. Together, these visuals enable insurance companies to use BI to uncover inefficiencies, pinpoint problem areas, and model the impact of operational changes.
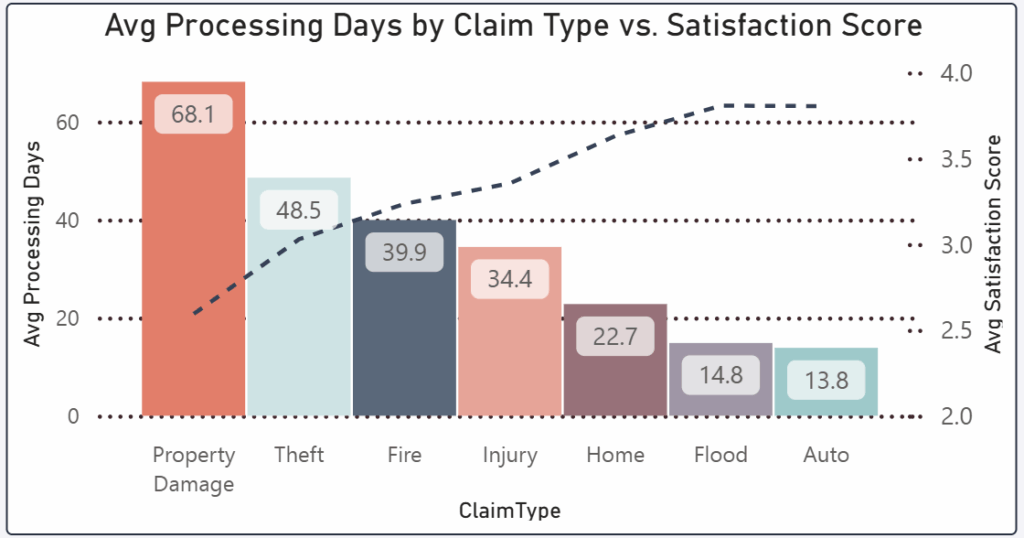
Average Processing Days by Claim Type and Satisfaction Score
This visual illustrates the relationship between claim types, average processing times, and customer satisfaction scores:
- Property Damage claims take the longest to resolve (68.1 days) and correlate with lower satisfaction ratings.
- Theft and Fire claims also have relatively long processing times (48.5 and 39.9 days, respectively), contributing to below-average satisfaction scores.
- Injury and Home claims show moderate delays but still fall short of high satisfaction.
- Flood and Auto claims are processed the fastest (14–15 days), leading to the highest satisfaction scores of nearly 4.0.
Long processing times directly impact customer satisfaction, as evidenced by the steep upward trend in satisfaction for claim types that are resolved faster. By prioritizing improvements for high-delay claim types, like property damage and theft, insurers can significantly close the gap and elevate customer trust.
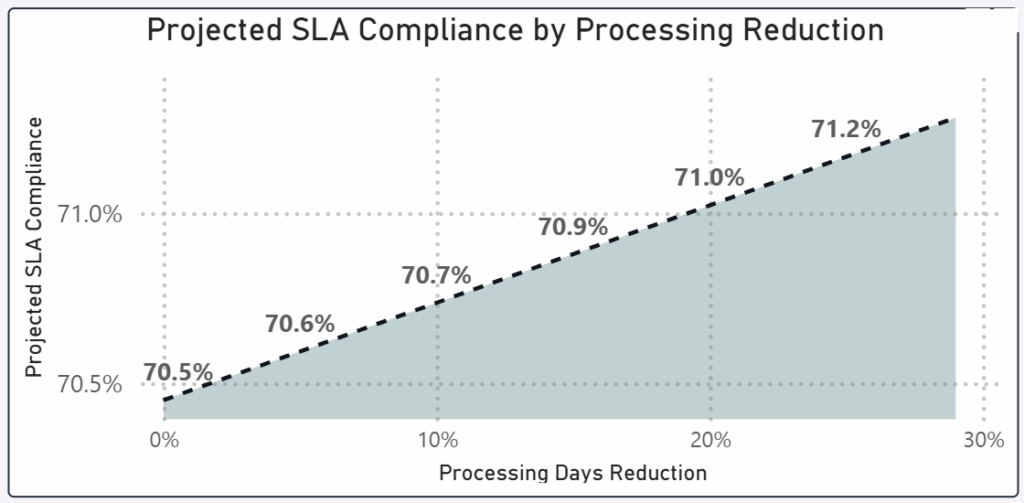
Projected SLA Compliance Chart
This chart demonstrates how reducing processing times can positively influence SLA compliance rates:
- 80%—the SLA target for claims-handling performance
- 70%—current SLA compliance
- 30%—reduction in processing delays would raise SLA compliance to 71%
Reducing processing times has a direct, positive effect on SLA compliance, helping insurers achieve their service-level goals. Similarly, faster claim resolution also boosts customer satisfaction and trust, driving stronger long-term business outcomes.
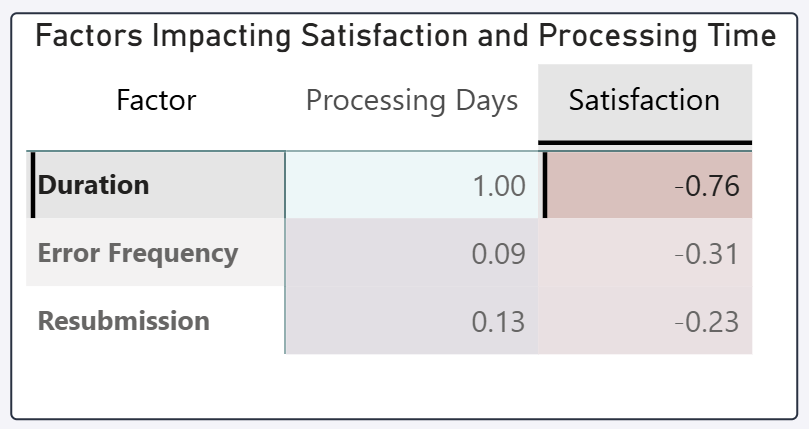
Correlation Heatmap
In this visual, we can measure the strength and direction of relationships between different operational factors, quantifying their impact on both processing days and customer satisfaction.
The data shows:
- Processing Duration (-0.76): Strong negative correlation, meaning longer processing times significantly reduce customer satisfaction.
- Error Frequency (-0.31): Moderate negative correlation, meaning more errors slightly increase processing time and lower customer satisfaction.
- Resubmission (-0.23): Weak negative correlation, meaning repeated resubmissions mildly contribute to longer processing times and lower customer satisfaction.
Overall, this heatmap makes it clear that reducing processing duration is the most impactful action to improve customer satisfaction.
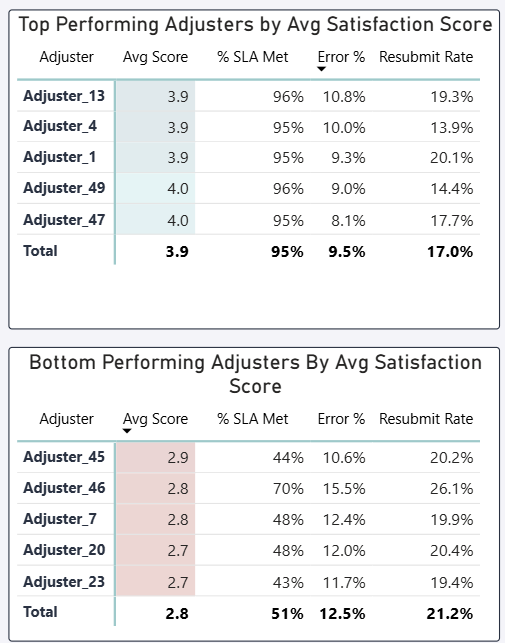
Top/Bottom Adjuster Perfomance Tables
This performance comparison reveals which adjusters excel at meeting SLA targets and which require improvement:
Top-performing adjusters:
- Highest average satisfaction scores (3.9–4.0)
- Strong SLA compliance (95–96%)
- Low error rates (around 9–11%)
- Average resubmission rates (17%)
These numbers indicate consistent efficiency and positive customer experiences. For example, Adjuster_49 achieved a 96% SLA compliance rate with a 4.0 satisfaction score and only 9% error frequency.
Bottom-performing adjusters:
- Low satisfaction scores (as low as 2.7)
- Poor to moderate SLA compliance rates (between 43 and 70%)
- High error frequencies (up to 15.5%)
- High resubmission rates (exceeding 20%)
These adjusters contribute to longer processing times and poorer customer experiences. Adjuster_45, for instance, met SLA targets in only 44% of cases and had a 2.9 satisfaction score, making this role a priority for improvement.
With these insights, insurance leaders can simultaneously recognize top performers to model best practices and identify underperformers who need targeted support to improve performance.
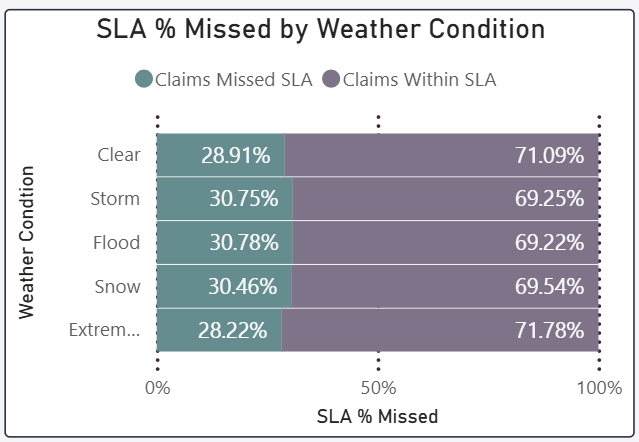
Weather Conditions Chart
This chart reveals how different weather conditions affect SLA compliance rates, highlighting the operational challenges posed by adverse weather:
- Lowest SLA Compliance: Claims filed during flood and storm conditions experience the highest SLA misses, with nearly 31% of claims not meeting SLA targets. Snow also contributes to delays, with a similar miss rate of 30.5%. These conditions likely complicate claim processing due to increased claim volume and logistical hurdles.
- Highest SLA Compliance: Claims filed during clear weather or extreme heat show better SLA performance, with SLA compliance rates over 71%. This suggests that weather stability positively impacts processing efficiency.
By addressing the factors causing SLA delays in adverse weather, insurers can allocate resources more effectively during high-risk conditions and maintain strong SLA performance.
Business Impact: Leveraging Claims Data for Faster Resolutions and Stronger Customer Trust
With BI dashboards delivering metrics like SLA performance trends and adjuster performance comparisons, insurance leaders can make faster, more informed decisions to improve operational efficiency, streamline claims processing, and boost customer satisfaction.
In this example specifically, leaders can use these insights to boost SLA compliance from the current 70% to the 80% target—an improvement that could lead to a 15% increase in customer satisfaction.
For example, using insights from BI dashboards, here are some key actions insurers can take to drive improvement:
- Upskill or Reassign Adjusters: By retraining underperforming adjusters or redistributing workloads to balance efficiency, insurance leaders can close performance gaps and increase overall SLA compliance.
- Focus on High-Delay Claim Types: With insights into where delays are most significant, insurance companies can strategically direct process improvements to minimize bottlenecks and improve SLA performance.
- Enhance Quality Control: Using data on error frequency and resubmissions, insurers can implement stronger quality checks to prevent mistakes that prolong claim resolution times.
Together, these actions don’t just close the SLA gap; they elevate the entire claims experience. With faster, more accurate claims processing, insurers can strengthen customer trust, improve retention, and position their companies as reliable partners for policyholders.
Key Takeaways: Why the Answer Is in the Data
These examples highlight just a few of the ways data can help insurance companies find ways to improve SLA compliance and strengthen customer trust.
Your data holds answers, but only if you know where to look. With these principles, we can turn your claims data into actionable insights that drive strategic decision-making:
- Processing delays are the hidden trust killer: While it’s easy to assume errors or complex claims are the biggest culprits, the data shows that long processing times have the strongest negative impact on customer satisfaction.
- Errors and resubmissions amplify inefficiencies: Even small increases in error frequency create ripple effects: longer processing times, more SLA misses, and lower satisfaction. But targeted quality control can break this cycle.
- Visualizing patterns makes them actionable: Seeing correlations between claim types, adjuster performance, and SLA compliance helps leaders quickly pinpoint where to focus process improvements for the greatest impact.
Every insurance company operates in a unique environment with different customers, claim types, and operational constraints. A one-size-fits-all approach won’t work—but a data-driven strategy ensures you can act faster, deliver better service, and build lasting customer trust.
Explore Other Data Stories and Submit Your Industry
Explore more LeapFrogBI Data Stories to see how other organizations are solving complex challenges with data:
- Boost Grocery Sales with Power BI: Data-Driven Strategies for Loyalty and Growth
- How to Use Data to Recruit Smarter and Close Workforce Gaps Across Oregon
What’s the biggest problem your industry is facing? Contact us to share your challenge, and we might feature it in a future story.
Because no matter the industry, the answer is in the data.