LeapFrogBI’s Data Stories spotlight real-world, niche business challenges—and show how a data-driven mindset always leads to better decisions, smarter problem-solving, and measurable results.
Because no matter the industry, the answer is in the data.
Wineries often create wine club memberships to drive sales—but few fully tap into the data those memberships provide. In this Data Story, we explore how business intelligence can uncover insights that boost personalization, membership retention, and long-term revenue growth.
Challenge: Growing Wine Club Memberships Without a Strategy for What Comes Next
Most wineries offer a wine club option to promote repeat customer sales. These memberships can be free or with a fee, typically with a sales discount and an option to get “exclusive” wines that will not be available to the public. For local members, some wineries may also host events to showcase new releases.
The allure of being part of this exclusive experience can draw customers to become wine club members. A minimum bottle purchase per quarter or a subscription-style purchase enables the winery to be profitable while guaranteeing the members will be repeat customers.
Typically, wineries’ marketing efforts focus on increasing memberships—but after you meet your target membership number, what’s the next step?
While growth is always a good measure, leveraging current membership data is the key to unlocking deeper insights, stronger loyalty, and more strategic decision-making.
Why This Challenge Matters: Your Members Are Sending Signals, But Are You Listening?
Wine flavors are just as abundant and different as the people who enjoy them. Learning the behavior of the wine club members is a great method for testing new flavors and releases. But while understanding the consumer is important, it may be difficult to evaluate the constant stream of data coming in.
With a custom wine club comes the option to gather as much or as little data as you want. For example, basic demographic information (e.g., gender, age range, and address) can help you understand who wants to be a repeat purchaser. Adding preference information (e.g., such as wine styles, flavor profiles, and pairing options) can help further customize wines for the members.
Having a way to accumulate all of this data is great—but what about when it comes time for data analysis?
That’s where a data-driven mindset makes all the difference, empowering you to turn raw information into actionable insights that power smarter decisions, stronger personalization, and long-term brand loyalty.
Solution: How to Find the Answer in the Data
Business intelligence (BI) is the process of analyzing business data and transforming it into meaningful insights you can use to make more strategic, data-driven decisions.
For BI consulting firms like ours, it’s more than just a process—it’s our passion. We work closely with stakeholders to understand their unique challenges, whether it’s optimizing production, improving distribution, or enhancing the tasting room experience. By gathering and analyzing the right data, we can help wineries uncover trends, streamline operations, and make decisions that support growth and sustainability.
Here’s how we can use data to help wineries personalize the member experience, increase profitability, and plan for long-term success:
1. Analyze Membership Retention
We track how long members stay subscribed and identify patterns around when and why they cancel.
For example, if you learn members consistently churn after six months, you can take proactive steps, like introducing timely perks, personalized offers, or other retention strategies, to re-engage them before the drop-off happens.
2. Understand Purchase Behavior and Preferences
We examine members’ purchase history, seasonal preferences, and average order values to understand what they actually want.
These insights allow for more personalized shipments that align with individual tastes, leading to higher satisfaction, fewer returns, and greater brand loyalty over time.
3. Identify Your Most Profitable Segments
We break down revenue by tier, location, and customer type (e.g., online versus tasting room sign-ups).
With these insights, we can spotlight your most profitable segments so you can focus marketing efforts where they’ll have the greatest impact.
4. Track Member Engagement
We pull in data from email campaigns, event RSVPs, and web activity to show how members interact with your brand.
This information helps you understand which communication channels and events drive the most engagement so you can refine your outreach strategy accordingly.
5. Forecast Future Growth with Predictive Modeling
By using predictive modeling on historical trends, we help wineries anticipate future membership patterns and wine demand.
These forecasts inform production planning and inventory decisions, reducing waste while keeping popular bottles in stock.
6. Surface Satisfaction Insights
We analyze reviews, survey feedback, and support logs to uncover what members love—and what they don’t.
Wineries can then use that input to improve the wine club experience, whether it’s refining selections, adjusting service, or introducing new perks.
Sample Visualization: See the Data-Driven Mindset in Action
We have created a mock-up report to analyze purchase behavior & preferences. Keep in mind that this dataset is completely fictionalized and made by hand, but just imagine how insightful the findings could be with your own data.
Find out What's Selling and When
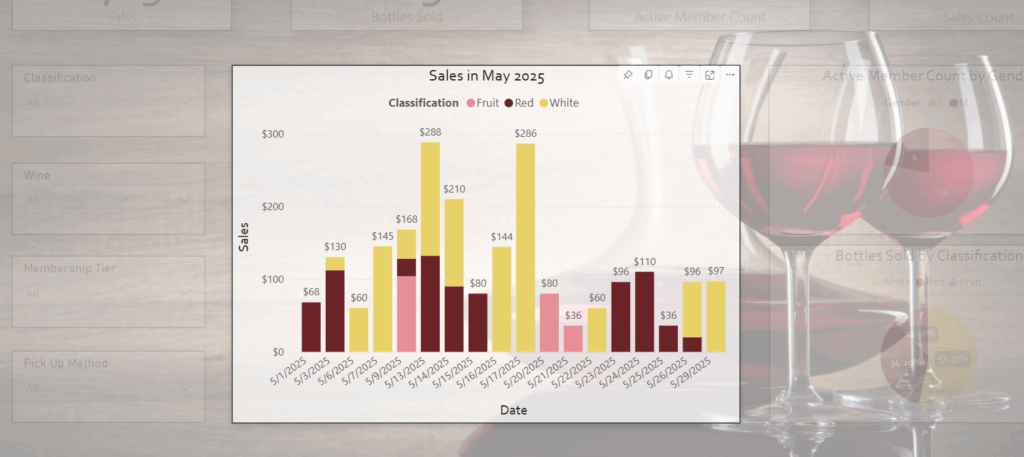
Sales numbers are great, but how easily can you segment your sales by active wine club members and by wine style?
With a business intelligence tool, such as Power BI, slicing the data becomes intuitive. For example, in the above visual:
- The bar chart represents sales ($) per day
- The colors represent wine styles (red, white, fruit)
- Days with multiple colors show the breakdown of wine types sold on that day
This mock-up shows just one month, and it’s easy to see that white wines were the most popular during that time.
On the flip side, fruit wines are the least popular. That could be due to a smaller selection in that category, or it could reflect lower demand, perhaps tied to flavor preferences. Either way, this insight helps guide decisions about what to stock for the spring and summer months.
Discover What Members Actually Want
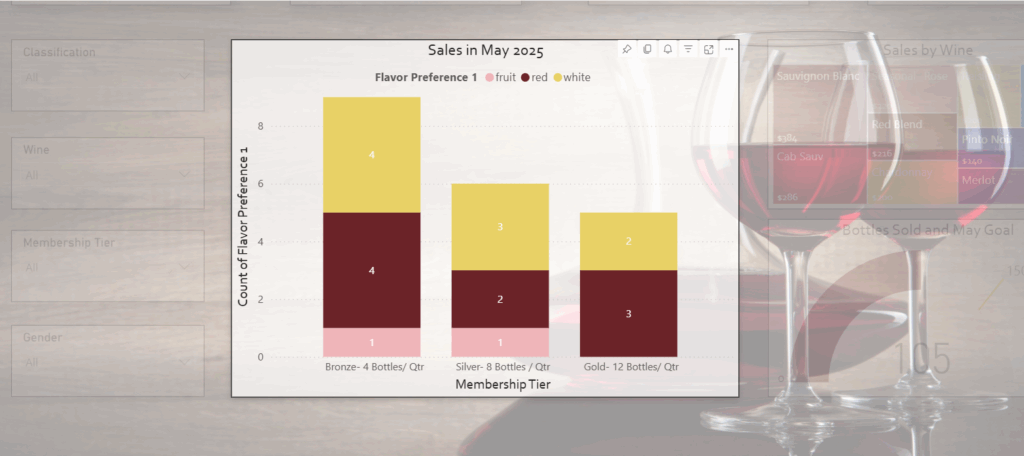
To dig deeper, we looked at wine club member preferences. From the data, we see that:
- Fruit wines show up least often in members’ preferred flavor profiles
- Red and white wine preferences are nearly even
So, the spike in white wine sales during May likely reflects seasonal demand, not just individual preference.
Over time, data like this helps wineries anticipate shifts in behavior and plan proactively.
How to Make Dashboards Work for You
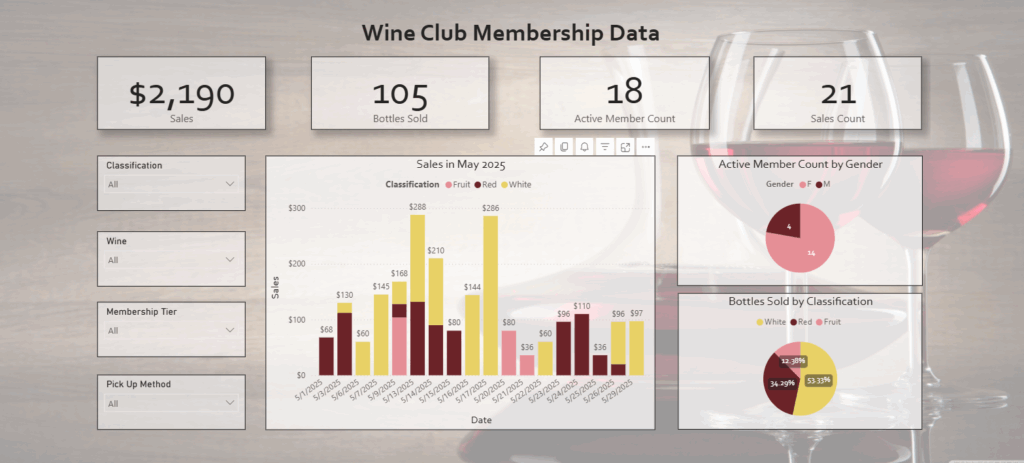
Dashboards can feel overwhelming when you see all the data at once—but the beauty of dashboards is that they’re highly customizable and can be as simple (or as detailed) as needed to help your business get insights.
The above dashboard is a sample, showing summary information at the top for quick, at-a-glance insights.
The dropdown options on the left (called slicers) let you filter the dashboard. For example, by selecting “Classification > Red,” you can filter to only show data about red wines.
The three center visuals are interactive. By clicking a field, you can filter other visuals to see how your data all works together.
The result? Fast, flexible decision-making that’s rooted in real insight.
Curious how these trends would look at your winery? View the interactive sample dashboard to explore the kinds of insights BI can surface.
Business Impact: From Data to Decisions That Drive Results
Overwhelmed by how such a small amount of data can stir up so many business insight questions?
Don’t be. Bring your questions to us. We transform your data to look clean and presentable. Then we deliver the data to you to assist in your decision-making.
The beauty of business intelligence is that it’s malleable, and we can form your data to visualize areas that interest you. Whether you’re exploring new ideas or answering long-standing questions, we shape the data around your goals—not the other way around.
Key Takeaways: Why the Answer Is in the Data
These examples highlight just a few of the ways data can reveal new opportunities to improve personalization and profitability.
Your data holds answers—but only if you know where to look. With these principles, we can turn your data into strategic wins:
- The story your data tells may be different than what you assume—member drop-off, flavor trends, or low sales might have deeper causes waiting to be uncovered.
- Tracking wine preferences, purchase behavior, and satisfaction feedback reveals what members actually value—so you can refine shipments, perks, and communication accordingly.
- Visual dashboards make complex information intuitive and accessible, giving winery owners a real-time window into what’s working and what needs attention.
Growing your wine club is just the beginning. The next step is using your data to deliver more value, deepen loyalty, and keep members engaged for the long run.
Got a business challenge you’d like us to explore? Contact us to share your industry challenge—and we might feature it next.
Because no matter the industry, the answer is in the data.