
Florist Inventory Dashboard
Report Description Flower shops use mainly fresh-cut flowers. These are perishable items, and if not sold in their lifespan, become waste. The world is focused on being more
Report Description Flower shops use mainly fresh-cut flowers. These are perishable items, and if not sold in their lifespan, become waste. The world is focused on being more

In this Data Story, we explore how tracking seasonality and maintaining shelf-life inventory can help guide decisions on purchasing to reduce waste and increase profitability.

Most software platforms promise fast insights with “built-in” dashboards—otherwise known as, canned, off-the-shelf reporting. Basically, you sign in, click a report, and boom—sales totals, headcounts,

Explore how wine club data analysis enhances membership retention and boosts winery sales through actionable insights.
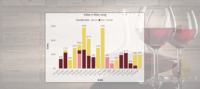
Here is a sample Power BI dashboard showing wine club membership data ready for analysis by wineries.

There’s been a lot of talk about Microsoft Fabric and what it means for data teams. Especially after LeapFrogBI sent half of our developers to
Prior to March 2025, I had only heard of “Microsoft Fabric” from logging into PowerBI and seeing the Fabric loading symbol. LeapFrogBI sent half of
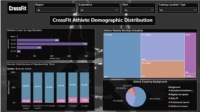
CrossFit is a dynamic and fast-growing industry where data can play a powerful role in driving business performance. While CrossFit gyms aren’t currently clients of LeapFrogBI, we created this report using sample data as a project to explore how analytics could support gym owners in making smarter decisions.

CrossFit gyms are built on energy, community, and transformation—but many still struggle with retention, marketing, and member insights. In this Data Story, we explore how

Have you ever worked with or seen a pie chart with too many slices? When you get beyond 5 or so slices it starts to turn into a mess.