Most businesses don’t need more technology—they need better decisions. That’s why we created Data Stories: a series that shows how you can solve any problem in any industry when you turn to the data.
Each story explores a niche business challenge and demonstrates how a data-first mindset powers better decision-making, smarter problem-solving, and measurable results.
Because no matter the challenge or the industry, the answer is always in the data.
Florists and greenhouses often face large quantities of waste from expired and dying cut flowers and greens. In this Data Story, we explore how tracking seasonality and maintaining shelf-life inventory can help guide decisions on purchasing to reduce waste and increase profitability.
Challenge: High Inventory Waste
A floral business can incur large quantities of waste from fresh goods, such as cut flowers that have not sold. Inventory wasted can decrease the business’ bottom line. In order to maintain the best possible profits, the business needs to maximize the amount of inventory sold and limit inventory waste.
High inventory waste can be common in fresh produce industries who are not tracking the shelf life of their products to produce sales prior to expiration dates. Other causes are listed below:
- Over ordering
- Not tracking on hand inventory
- Receiving poor quality goods
- Seasonality of goods
Why This Challenge Matters: Trashed Inventory is Trashed Revenue
A florist has to purchase their flowers and greens typically by the stem. However, if the florist is unable to sell all of the items purchased, they have to be thrown in the trash and are no longer of value to the business. This is similar to perishable goods at a grocery store. A florist has some items that do not expire (vases, gift shop items, ribbons, etc.), but the opportunity to maximize profit relies on making sure the perishable products sell before they are considered waste. To increase profitability, the business must understand the opportunity to reduce the waste.
Higher waste results in a higher cost of inventory which means less profit.
In addition to profitability, many businesses are concerned with sustainability. A business can use its sustainability practices as a marketing angle thereby contributing to increased revenue. In 9 Ways to Make Your Floral Business More Sustainable – #9 is a trash Audit- all roads lead to an inventory dashboard.
Solution: How to Find the Answer in the Data
A simple inventory dashboard is a visually appealing way to find the solution. With a few options to click to gather more information, the user can use a dashboard to track what inventory they have, each item’s shelf-life, and the seasonality of the item to promote sales during the product’s best season.
Here’s how we use data to help florists solve inventory waste:
1. Gather the Inventory
- Most businesses have a digital copy of their inventory
- Can be hard to navigate
- Not visually appealing
- Inventory can be migrated into a database to feed information into a dashboard
- Easy to navigate
- Customizable
- Visually appealing
2. Segment the inventory based on shelf-life
- Dashboard can identify ordering in season products to promote to customers for better quality goods
- Dashboard can add dollar amounts to inventory by groupings to view which types of items are impacting the bottom line the most
- Cost of wasted items
3. Analyze the cost of the perishable inventory
- Gather shelf-life of highest cost wasted inventory
- Find alternatives
- Are these products in season?
- Is the business over ordering?
- Is the business receiving these goods in poor condition?
- Is the business practicing First Expired First Out inventory management?
- Adjust business practice based on analysis to reduce waste in critical categories
By analyzing the inventory of fresh goods within the business, adjustments to reduce waste can more easily be made on the highest goods wasted in any season.
Sample Visualization: See the Data-First Mindset in Action
The following visualizations were created using sample florist inventory data.
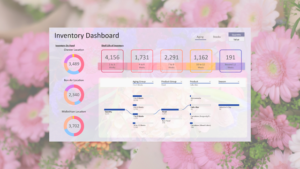
Inventory Dashboard- Aging Quantity
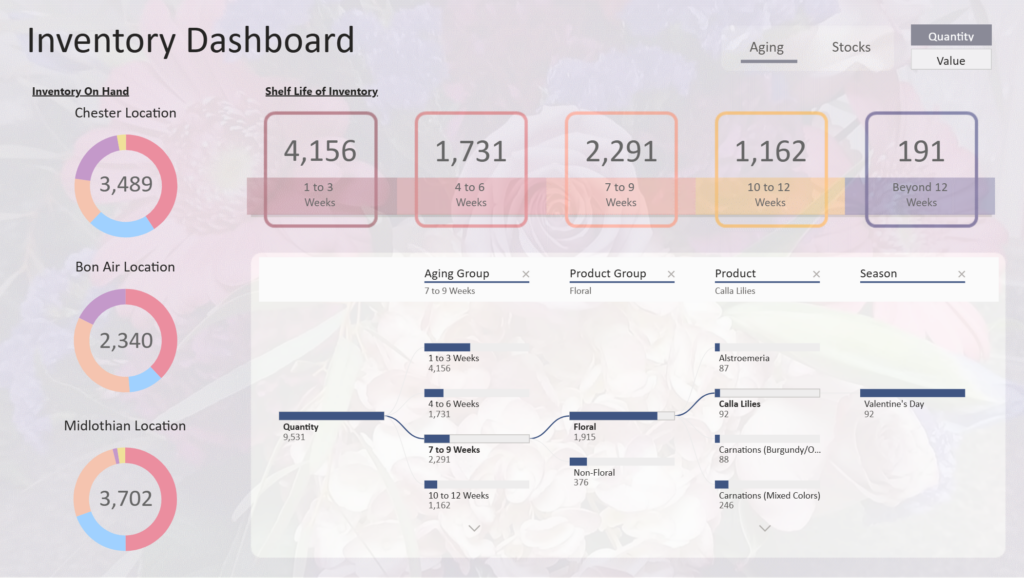
This dashboard shows the quantity of inventory on-hand for several flower shop locations. The left is the total inventory per 3 locations. The top boxes show the quantity on hand of items within their shelf-life buckets. The bottom graph allows a user to click through the aging groups to see the products and their seasonality. This page can be used to see that there are more products expiring in 1-3 weeks than any other aging bucket. The business can use the bottom visual to dig into what those products are, and to see if they are not selling due to being out of season. From there the business can analyze if they need to promote or fire-sale any items to make sure they sell before they are considered waste.
Inventory Dashboard- Aging Value
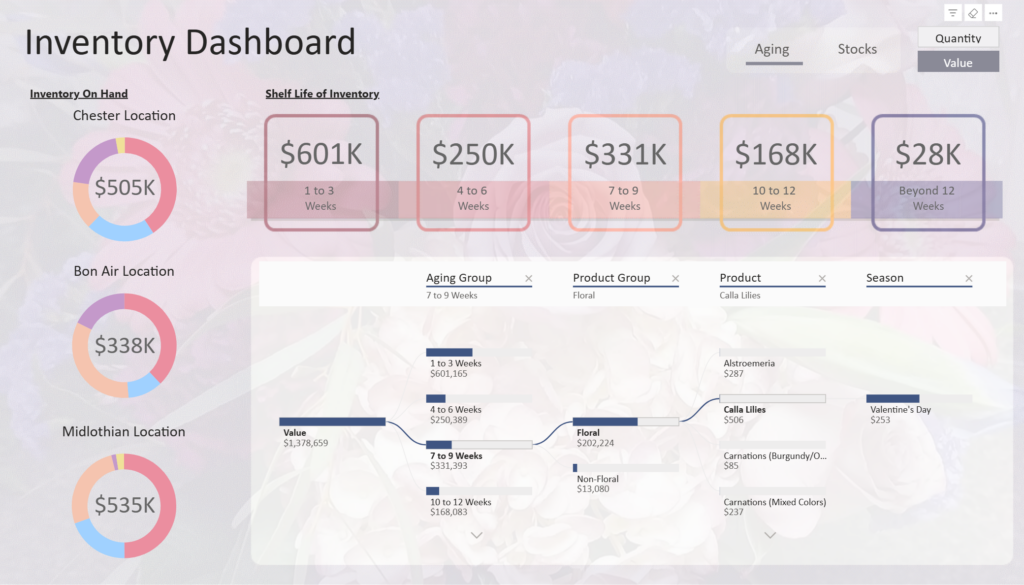
This is the same dashboard as above, but now in terms of cost of inventory. Using this dashboard can provide many insights, such as showing that the location Midlothian has the highest cost of stock. If this location in turn does not have the highest sales, they may need to reallocate resources to another location to reduce waste. This can also help the flower show focus in on the highest cost products to reduce that waste first, whether it is ordering less of that product or promoting it during peak season.
Inventory Dashboard- Stock
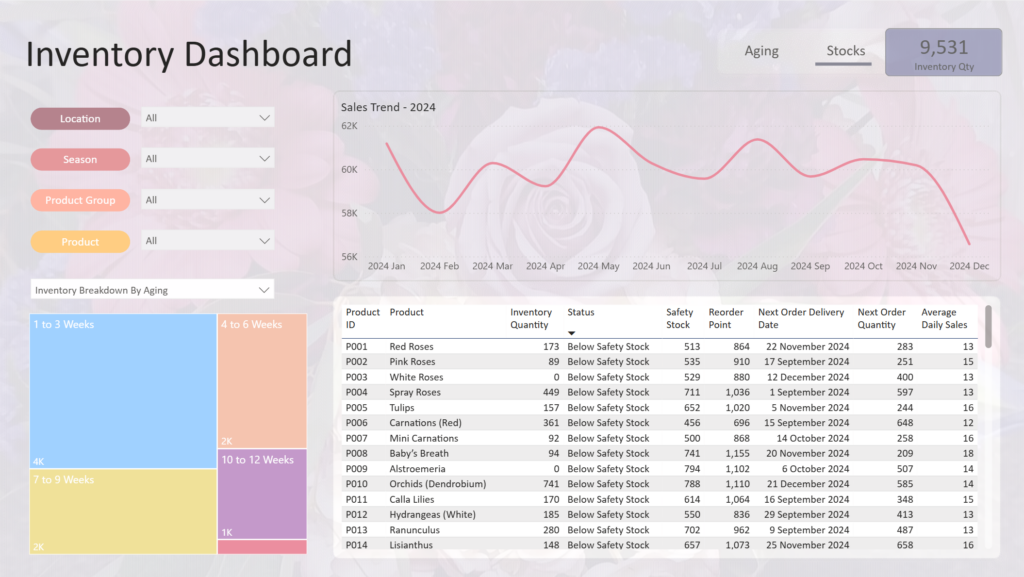
The stocks selection changes the dashboard to be a representation of inventory stock. The user can view this at the high-level, or make selections to location and product to see a more narrow-view (top left). The bottom left visual displays Inventory Breakdown by Aging, Location, Season, or Product Group to see what groups have the highest level of inventory. The image above shows by Aging, so the largest boxes have the highest on-hand inventory expiring the soonest. The top-middle visual shows sales trends over a year to indicate seasonality of when it would be best to have more inventory stocked. The bottom visual is a table showing all the inventory and relevant inventory information for ordering and how quickly those items typically sell.
Curious how these trends would look at your business? View the interactive sample dashboard to explore the kinds of insights BI can surface.
Business Impact: Reduced Waste of Perishable Goods
By making decisions based on relevant information in the dashboard, the flower shop can now save money on waste and increase profit. The flower shop can quickly adjust how they are ordering items based on what they have on-hand that needs to be utilized first. They can also check the seasonality of products to make sure they are purchasing and promoting in-season item sales for better quality goods. Maintaining limited inventory of items known to have short shelf-lives will allow the business to sell the inventory before it becomes waste.
Improvements:
- Marketing – promoting seasonal items, sales on soon-to-expire items
- Cost savings – reducing waste
- Better service – higher-quality goods going to the customers
- Decision-making is easier with information that is easier to digest
Key Takeaways: Why the Answer is in the Data
These examples highlight just a few of the ways data can reveal new opportunities to improve reducing waste and managing inventory.
Your data holds answers—but only if you know where to look. With these principles, we can turn your data into strategic wins:
- Key Insight #1 – The highest inventory was on items with the shortest shelf life. The flower shop can use this information to determine what inventory to use first, and potentially adjust the purchasing to items with better shelf-life during slower seasons.
- Key Insight #2 – Understanding which items the flower shop is not selling even though they are in-season can help with marketing efforts to promote the freshest flowers based on seasonality.
- Key Insight #3 – Instead of parsing through the inventory order forms to determine which products are costing the most, comparing the products on a dashboard with relevant information of shelf-life can make decision-making easier.
Every flower shop is different. A one-size-fits-all approach won’t work—but a data-first strategy ensures you’re ready for whatever comes next.
Explore Other Data Stories and Submit Your Industry
Explore more LeapFrogBI Data Stories to see how other industries are solving problems with data:
Got a business challenge you’d like us to explore? Contact us to share your industry challenge—and we might feature it next.
Because no matter the industry, the answer is in the data.