Most businesses don’t need more technology—they need better decisions. That’s why we created Data Stories: a series that shows how you can solve any problem in any industry when you turn to the data.
Each story explores a niche business challenge and demonstrates how a data-driven mindset powers better decision-making, smarter problem-solving, and measurable results.
Because no matter the challenge or the industry, the answer is always in the data.
County leaders know better than most that development doesn’t move in a straight line. Population surges, shifting land availability, and rising environmental pressures are just a few of the forces that can accelerate growth—or stall it when conditions change.
In this Data Story, we explore how counties in California can use Business Intelligence (BI) to understand the balance between supply, demand, and sustainability. By bringing together data on population trends, permitting activity, land use, and environmental risk, this one‑page report helps leaders quickly spot where opportunities exist—and where hidden constraints may complicate future development. The visuals work together to reveal the dynamics shaping growth today and the decisions that will guide it tomorrow.
Challenge: Misaligned Development Activity
The data reveals a growing misalignment between development activity and true opportunity. Statewide permits are declining even as population continues to rise, creating pressure on housing and infrastructure. But the deeper issue emerges at the county level: permit activity does not consistently align with opportunity scores.
High‑opportunity counties with strong fundamentals are seeing limited construction, signaling barriers that may be restricting growth. Meanwhile, some lower‑opportunity counties are issuing comparatively high numbers of permits, raising concerns about sustainability and whether development is occurring in areas that can support it long‑term. Environmental risk further complicates the picture, as several high‑opportunity counties also fall into higher‑risk tiers.
Why This Challenge Matters
This imbalance has meaningful consequences for long‑term planning and regional stability. When development lags in high‑opportunity areas and accelerates in lower‑opportunity or higher‑risk ones, counties face:
- Housing shortages where demand is strongest
- Inefficient allocation of public resources and infrastructure investment
- Increased exposure to environmental and long‑term risk
- Lost economic potential in counties positioned for sustainable growth
- Overbuilding in areas that may not be able to support it
For policymakers, developers, and investors, understanding these dynamics is critical to making informed, strategic decisions. By surfacing these patterns in a single page, the data story helps leaders quickly identify where intervention is needed—whether that means removing barriers in high‑opportunity counties, reassessing development patterns in lower‑opportunity areas, or balancing growth with environmental risk. It clarifies where the state is building, where it should be building, and where caution is warranted.
Solution: How to Find the Answer in the Data
County development decisions become clearer when the data is viewed together. This section shows how each visual helps pinpoint why permits, opportunity, population, and environmental risk may be out of sync—and where counties can take targeted action to realign growth with true opportunity.
Step 1: Set the Context with right KPIs
Before analyzing where development is aligned—or misaligned—you need a clear snapshot of the statewide landscape. That starts with collecting the core KPIs that frame supply, demand, and opportunity:
- Total permits issued statewide
- Permit year‑over‑year growth (%)
- Total population
- Population growth (%)
- Average opportunity score
These indicators form the foundation of the entire analysis. Without them, it’s impossible to understand whether development activity is keeping pace with population trends or whether opportunity is being fully leveraged. In this case, the KPIs reveal a clear imbalance: population continues to grow while permit activity is declining, and the average opportunity score sits at a neutral midpoint. Establishing this context is critical—it tells us what’s happening at the statewide level before we zoom in to see where and why the patterns diverge across counties.
Step 2: See Where Development Aligns—and Where It Doesn’t
By combining key development signals, leaders can quickly see whether growth is happening in the right places.
When opportunity, permit activity, population, and environmental risk are viewed together, the patterns behind county‑level development become immediately clear.
At a glance, you can spot counties with strong fundamentals that aren’t seeing the permit activity you’d expect—clear signs of untapped potential. You can also see the opposite: counties where construction is outpacing underlying opportunity, raising questions about long‑term sustainability. When environmental risk is layered in, the picture sharpens further, revealing where attractive opportunities may also carry significant long‑term challenges.
This integrated perspective helps decision‑makers move beyond isolated metrics and quickly identify where development is aligned with opportunity—and where it’s drifting off course.
Step 3: Rank Opportunity with Population Context
Comparing opportunity alongside population size helps clarify the true scale of potential across counties. High opportunity in a small county may signal targeted, niche growth, while similar scores in larger counties point to broader, more scalable impact.
By layering population context onto opportunity rankings, leaders can distinguish where strong scores represent meaningful, system‑wide potential versus where they reflect smaller, localized advantages. This prevents overinterpreting high scores in low‑population areas and ensures that opportunity is evaluated with the right sense of scale.
Step 4: Layer Risk with Opportunity Tiers
Understanding how environmental risk intersects with opportunity is essential for making sound development decisions. When counties are grouped by opportunity tier and evaluated through a risk lens, a clear tension emerges: many of the most promising counties also face elevated or extreme environmental risk. Strong fundamentals may be present, but long‑term vulnerability complicates the path forward.
At the same time, counties in the moderate‑opportunity range often show far lower risk profiles. These areas may not have the highest scores, but they offer steadier, more sustainable growth potential. By weighing opportunity alongside risk, leaders can identify which counties are positioned for strategic investment, which require caution, and where balanced, long‑term development is most achievable.
Sample Visualization: See the Data-Driven Mindset in Action
This report uses data from reliable federal and state sources to understand county‑level growth and opportunity. Building permit trends come from the U.S. Census Bureau, transportation project information comes from Caltrans, and labor data comes from the Bureau of Labor Statistics. Weather and climate risk are informed by NOAA, and population and economic details come from the American Community Survey. Together, these sources provide a clear picture of development activity and local conditions.

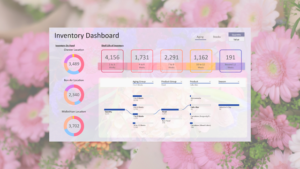
Top-Line Metrics: Statewide Development Snapshot
These KPIs set the foundation for understanding development across counties. Looking across the top of the report you will find the following:
- 102,000 permits have been issued statewide, yet permit activity is down 9.14% year-over-year, signaling a slowdown in construction.
- Meanwhile, population continues to grow, reaching 39 million with a 0.59% growth rate—more than five times the baseline goal.
- The average opportunity score is 6, a neutral benchmark for comparing counties.
This imbalance—rising demand, falling supply, and middling opportunity—raises a critical question: Are we building in the right places? These metrics frame the deeper analysis that follows.
How the Opportunity Score Is Calculated
The opportunity score blends five independent signals into a single measure of growth potential: permit activity, population growth, affordability, labor costs, and an environmental risk penalty. Each county receives a score for these factors, which are then added together to create one comparable number. Permit and population trends capture momentum and demand, affordability and labor costs reflect feasibility, and the environmental penalty ensures long‑term risk is accounted for rather than masked. This combined score provides a balanced view of where conditions are most favorable for future development.

Are We Building Where Opportunity Exists?
The central question is whether development activity is occurring in the right places. This visual makes that clear by showing how opportunity, permit activity, population, and environmental risk interact across counties. Ideally, counties with strong fundamentals would cluster together—high opportunity paired with high permit activity. Instead, the picture is far more uneven.
Some counties with strong opportunity scores and sizable populations show limited permit activity, revealing untapped potential where barriers may be slowing growth. Others with lower opportunity scores are issuing more permits than expected, raising concerns about sustainability and possible overbuilding. When environmental risk is layered in, the story becomes even more nuanced: high‑opportunity counties facing elevated risk are not straightforward opportunities but areas where long‑term vulnerability must be weighed carefully.
This combined view helps leaders quickly see where development is aligned with true opportunity—and where it is drifting off course.
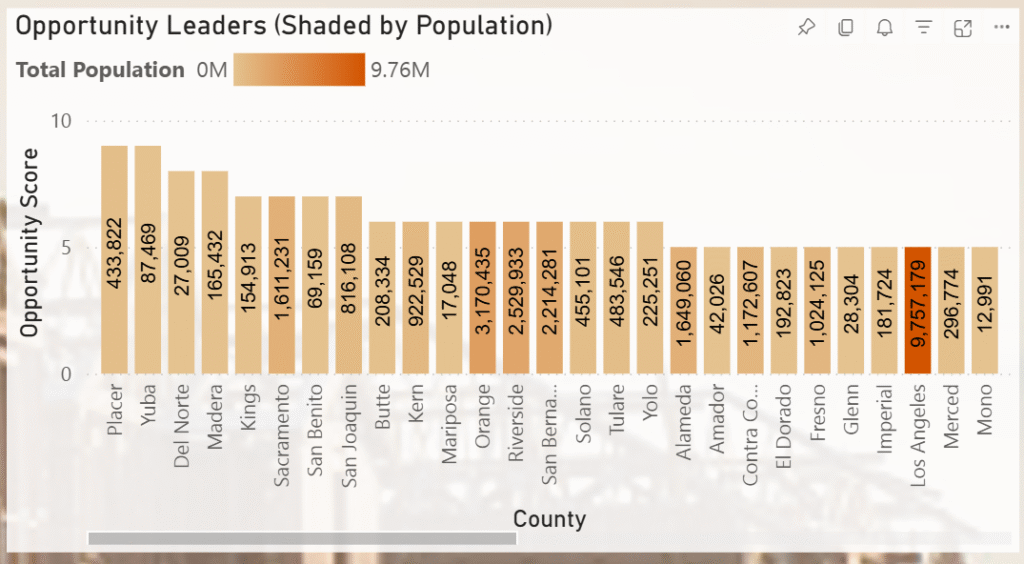
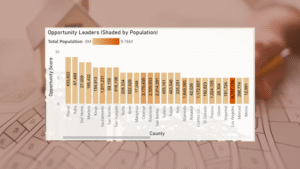
Opportunity Rankings
This section highlights which counties rise to the top in opportunity—and, just as importantly, how population size reshapes the meaning of those scores. Ranking counties by opportunity alone can be misleading; a high score in a small county signals something very different than the same score in a large, densely populated one. By viewing opportunity alongside population, the true scale of potential becomes clear.
Counties like Placer and Yuba stand out for their strong opportunity scores, yet their population bases differ dramatically. Some high‑scoring counties represent niche, localized potential, while others combine solid opportunity with large populations, signaling far broader, statewide impact. The key insight is that opportunity cannot be interpreted in isolation. Scale matters. Smaller counties may offer targeted investment prospects, but larger counties are where strategic decisions can influence growth at a meaningful level.
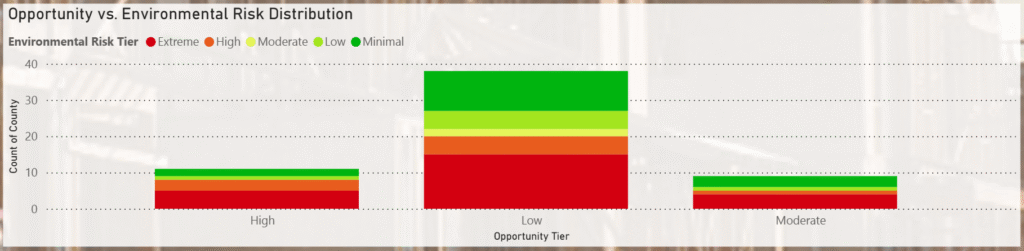
Balancing Opportunity with Environmental Risk
This section highlights how environmental risk reshapes the meaning of opportunity across counties. Grouping counties into high, moderate, and low opportunity tiers brings a critical tension into focus: many of the areas that appear most promising on paper also carry elevated or even extreme environmental risk. That combination complicates investment decisions. A county may score well on opportunity, but if it sits in a high‑risk tier, long‑term vulnerability becomes a central concern.
At the same time, some moderate‑opportunity counties show minimal environmental risk, positioning them as steadier, more resilient options for long‑term development. These counties may not top the opportunity rankings, but their lower risk profiles make them attractive for sustainable growth.
The key takeaway is clear: opportunity cannot be evaluated without accounting for risk. Sustainable development requires weighing both potential and vulnerability to identify counties where growth is not only possible, but durable.
Business Impact: Smarter Growth Strategies
With this data story, county leaders can:
– Target investment in high-opportunity, low-risk areas.
– Avoid overbuilding in unsustainable regions.
– Improve forecasting and resource allocation.
– Align development with population trends.
– Make faster, more confident decisions.
Key Takeaways: Why the Answer is in the Data
The full picture only becomes clear when these metrics are viewed together. By combining permits, opportunity, population, and environmental risk, the report surfaces patterns that would be invisible in isolation. It shows where development momentum aligns with real potential, where growth is lagging despite strong fundamentals, and where long‑term risk complicates otherwise attractive opportunities. These insights reveal not just what is happening, but why, and where leaders should focus next.
Opportunity and Activity Don’t Always Line Up: The report shows clear mismatches between where opportunity is strongest and where permits are actually being issued. Some high‑opportunity counties aren’t seeing the development momentum they should, while others with weaker fundamentals are building more than expected.
Scale Changes the Meaning of Every Score: Looking at opportunity through the lens of population reveals which counties offer niche potential and which ones carry true statewide impact. High scores mean different things depending on the size of the community behind them.
Risk Reframes the Growth Conversation: Environmental exposure reshapes the interpretation of opportunity. High‑opportunity counties with elevated risk require caution, while moderate‑opportunity, low‑risk counties may offer steadier, more sustainable paths forward.
Together, these insights show why a data‑first approach is essential. When permits, opportunity, population, and environmental risk are viewed side by side, the path forward becomes clearer: focus on the counties where momentum and potential align, approach high‑risk areas with intention, and recognize where scale amplifies impact. The data doesn’t just inform the conversation; it points directly to where strategic action will matter most.
Explore Other Data Stories and Submit Your Industry
- The Busy Bee Coffee Shop: Turning Data into Sweet Success
- How to use Insurance Claims Data to Improve SLA Compliance and Trust
- Maximize Restaurant Revenue Amidst Seasonal Sales Fluctuations.
Got a business challenge you’d like us to explore? Contact us to share your industry challenge, and we might feature it next.
Because no matter the industry, the answer is in the data.
Resources
U.S. Census Bureau – Building Permits Survey County and city-level construction permit data by structure type. Used to identify construction activity and growth trends. URL: https://www.census.gov/construction/bps/
California Department of Transportation (Caltrans) State and regional transportation infrastructure projects, including road and bridge construction opportunities. URL: https://dot.ca.gov/programs/
Bureau of Labor Statistics (BLS) Construction labor force availability, wages, employment levels, and trucking-related labor statistics. URL: https://www.bls.gov/oes/
National Oceanic and Atmospheric Administration (NOAA) Climate and weather data used to assess construction seasonality and weather-related risk. URL: https://www.noaa.gov/climate/
U.S. Census Bureau – American Community Survey (ACS) Economic and demographic indicators supporting market opportunity analysis. URL: https://www.census.gov/programs-surveys/acs/