
CrossFit gyms are built on energy, community, and transformation—but many still struggle with retention, marketing, and member insights. In this Data Story, we explore how business intelligence can turn gym data into action that drives growth and loyalty.
Challenge: Membership Decline and Growth Plateaus
If CrossFit is so popular among its athletes, why do gyms struggle with retention and growth?
The answer to this question will vary from gym to gym. Through BI insights, we can help excavate the information needed to pull a struggling gym out of the ruts.
Several reasons for declining membership could include:
- Economic hardships
- Lack of accountability in the gym
- Over-training
- Not enough variety in classes
- Too-large classes
- Not seeing any physical results
While any or none of these could be a contributing factor, there is a need for marketing efforts to garner interest and new membership growth.
Why This Challenge Matters: Spot the Patterns Before They Become Problems
Retention and sustainable growth are critical for CrossFit gyms, where community is everything and small shifts can lead to major membership changes. Without the ability to spot patterns, many gym owners are stuck reacting instead of improving.
Declining membership doesn’t always come with obvious reasons. Business intelligence helps connect the dots, like changes in class schedules, member demographics, or seasonality, so you can address root causes, not just symptoms.
Solution: How to Find the Answer in the Data
So, what is Business Intelligence (BI), and why should gyms be interested?
Business intelligence uses technology to analyze data and turn it into actionable insights that leaders can use to make more informed, strategic decisions. For BI consulting companies like LeapFrogBI, that means working directly with stakeholders to understand their goals and deliver the data they need to take action.
Here’s how we can use data to help CrossFit gym owners solve membership decline and growth plateaus:
1. Gather and integrate data from your gym
First, we gather your specific gym’s data. This data can come from multiple platforms (e.g., HR, membership management, marketing platforms) and include things like:
- Memberships, historical and present
- Athlete demographic information
We extract and transform all this data to be easily understandable, integrating into one easy-to-read report.
Then, we track trends among factors like:
- Athletes
- Seasonality of memberships
- Demographic shifts
Finally, we have a conversation with the business owner, explaining what the data shows and how
they can use this data to support their next marketing push.
For example, maybe they notice several women all dropped their memberships around the same time, and then they realize they had stopped offering childcare around that time as well. This may seem like an obvious correlation, but as a small- to medium-sized business owner, you may not be paying attention to these types of details, and that’s understandable.
2. Layer in industry benchmarks
Industry data can also help with comparing your unique business to the overall marketplace.
CrossFit has a large resource of affiliated gyms, and being able to harness data gathered from multiple resources can help pick up on what is a global trend, versus an internal factor. Using business intelligence to notice these trends before the rest of the market can also give your gym a competitive advantage to make marketing shifts early.
By combining gym-specific metrics with larger industry insights, business intelligence gives you the ability to act quickly, confidently, and competitively.
Sample Visualization: See the Data-Driven Mindset in Action
The following visualizations come from a mock dataset based on athlete demographic data collected from local CrossFit competitions.
Dashboard: CrossFit Athlete Demographic Distribution
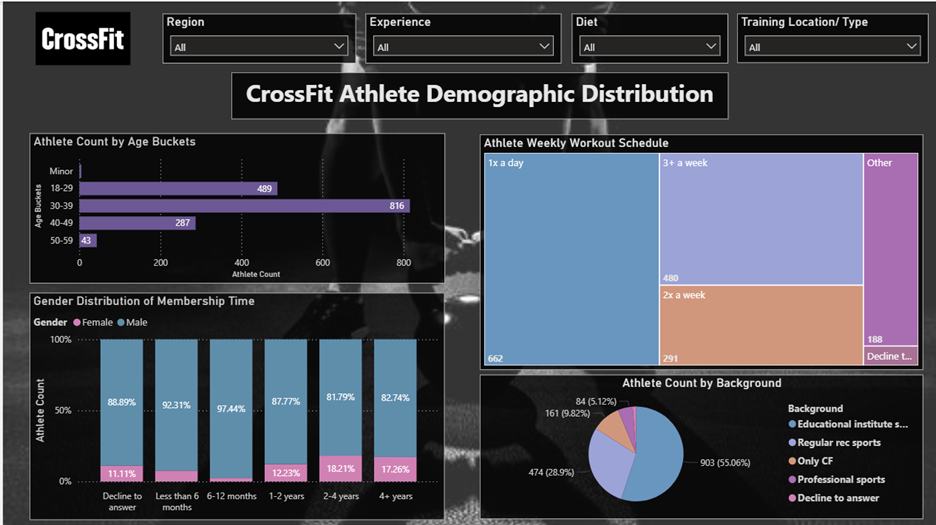
CrossFit hosts various competitions throughout the year. These can be global, such as the CrossFit Open or CrossFit Games, or they can be local and hosted by a small gym. Typically, these competitions are open to athletes of all skill levels (having the courage to enter a competition may be limited to higher skill levels though).
When athletes enter these competitions, they may have to submit their demographic information, such as age, gender, address, what gym they attend, and how often they work out. This demographic information is used to create a sample dashboard of what insights we can gather just from athletes who compete.
Spotlight: Gender Distribution of Membership Time
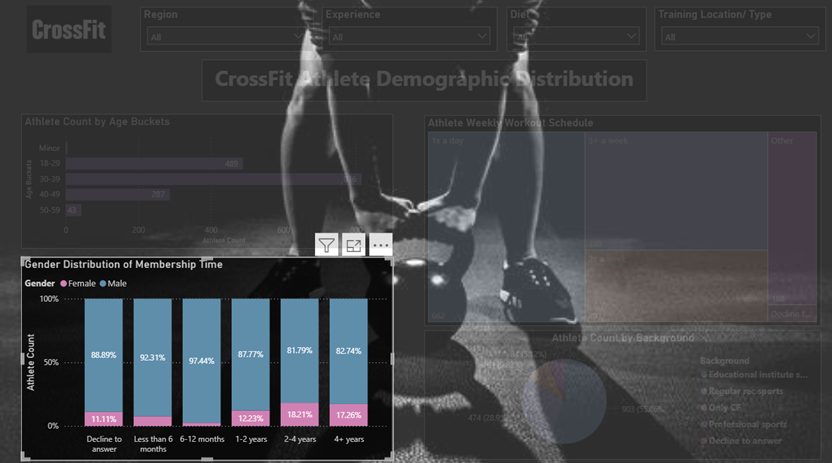
In this sample dashboard, we can see that the gender distribution is greatly skewed towards males between 30-39 years old.
This is an indicator that these competitions may have been hosted at smaller gyms, as the CrossFit Games hosts a 50/50 split of males and females. This is helpful for us to understand and allows us to utilize the dashboard more effectively.
Since males are the primary demographic, this may be an indicator to market to more females. However, males may just generally be more competitive, hence more entering competitions.
This information allows the business owner to gear their classes more towards being competition-ready for males, while allowing more scaling and flexibility for females.
Spotlight: Athlete Weekly Workout Schedule
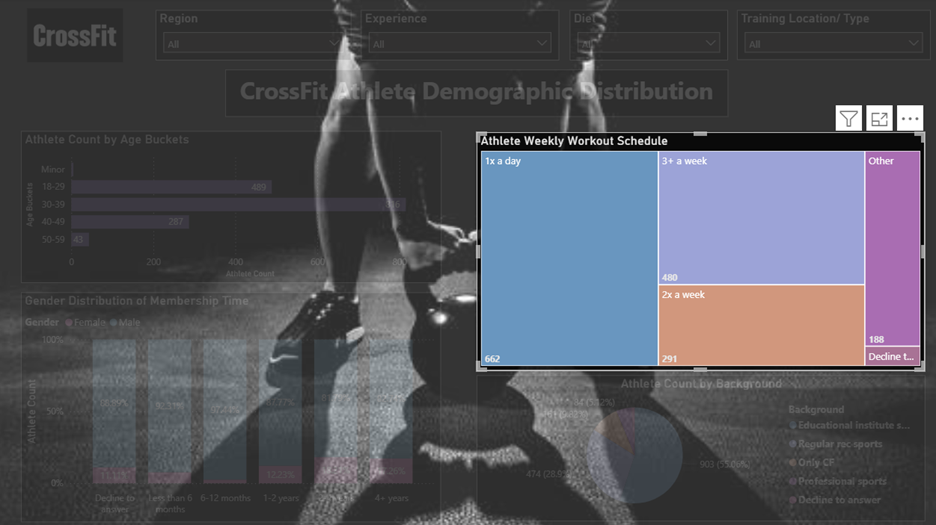
Another trend that stands out is that most athletes have stated they work out once a day.
If the gym is not open, they likely are finding another avenue to get their workout in. Having a schedule to allow athletes to work out at the gym every day might be a business-driver.
As a CrossFit gym owner, safety is also important, and daily workouts can lead to burnout or injury, so having alternative workout days can help prevent injury by gearing that day’s workouts towards flexibility, mobility, stretching, and recovery.
Spotlight: Athlete Count by Background
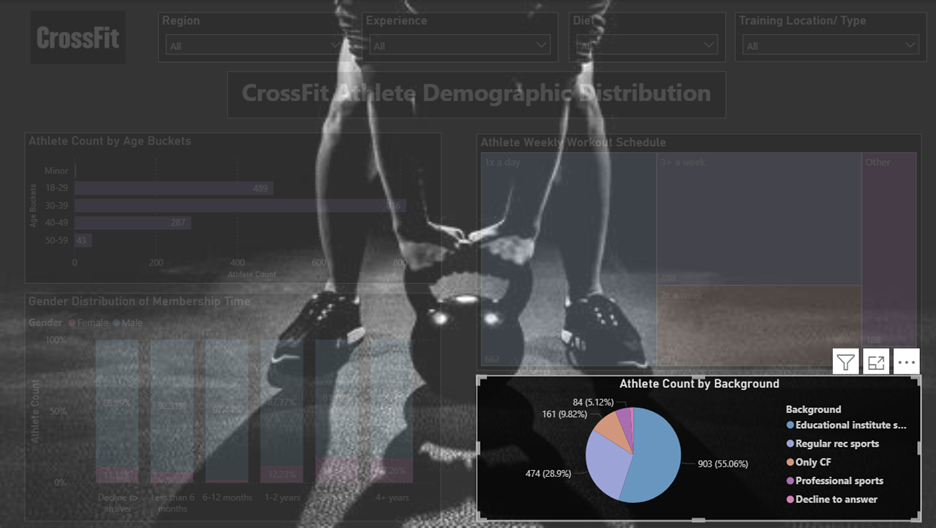
For additional insight, this dataset offers information on whether the athlete had prior fitness experience.
The pie chart in the bottom right offers that most athletes who competed have a background in educational institute sports. For analysts, this explains the competitive nature of the athletes, as they have a history of competing in sports in school.
To promote the retention of these athletes I would suggest adding games in the workout—whether that is a warm-up game of short sprint tic-tac-toe or a workout where your team has to get the most reps in the time frame.
Curious how these trends would look at your gym? View the interactive sample dashboard to explore the kinds of insights BI can surface.
Business Impact: From Data to Decisions That Drive Results
From uncovering why members leave to highlighting underused programs, the data gives owners clarity that’s impossible to achieve through gut instinct alone.
Working with a business intelligence company to see the approach that works best for your business is the only way to be able to ensure you can pivot your needs as quickly as they appear.
Key Takeaways: Why the Answer is in the Data
These use cases offer just a glimpse of how data can uncover new opportunities to improve performance and increase memberships.
Your data holds answers—but only if you know where to look. With these principles, we can turn your data into strategic wins:
- The story your data tells may be different than what you assume—dig into it.
- Combining gym-specific data with industry-wide benchmarks reveals what’s local vs. systemic.
- Visual dashboards make insights accessible, not overwhelming.
Every gym is different, and a one-size-fits-all all approach is not feasible. Working with a business intelligence company to see the approach that works best for your business is the only way to be able to ensure you can pivot your needs as quickly as they appear.