Author: LeapFrogBI

Gross profit and gross margin by full date - sales dashboard

Sales Dashboard and Reports (Sample Data)

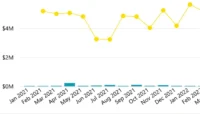
This interactive live dashboard lets you explore and engage with the data. It shows how information can be tailored for different stakeholders and how one visual can instantly filter others on the same page for deeper insights

Insurance Dashboard and Reports (Sample Data)

This interactive insurance dashboard showcases how “report-ready” data can be easily explored using Power BI. Navigate through pages like Producer Revenue, Premium Plan, and Policy Overview to gain valuable insights tailored to different areas of your business.

advanced insurance analytics - poliicy flow diagram

Insurance Underwriting Efficiency Analytics

Insurance underwriting efficiency analytics help carriers and managing general agencies optimize outcomes. This process diagram tracks policies from submission to bound. What it is: One