When developing a reporting solution there are a variety of possible solution architectures to choose from. The available architectures range in complexity and purpose, and it is important to choose the right architecture to match your needs.
While a dimensionally modeled data warehouse offers the most flexibility for handling highly complex requirements, it comes with a cost. To avoid this cost, especially when first implementing a reporting solution, many companies are pointing Power BI directly at source systems and skipping the external data solution.
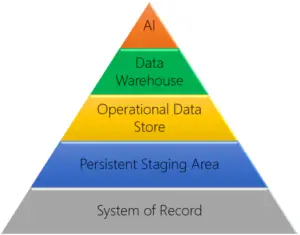
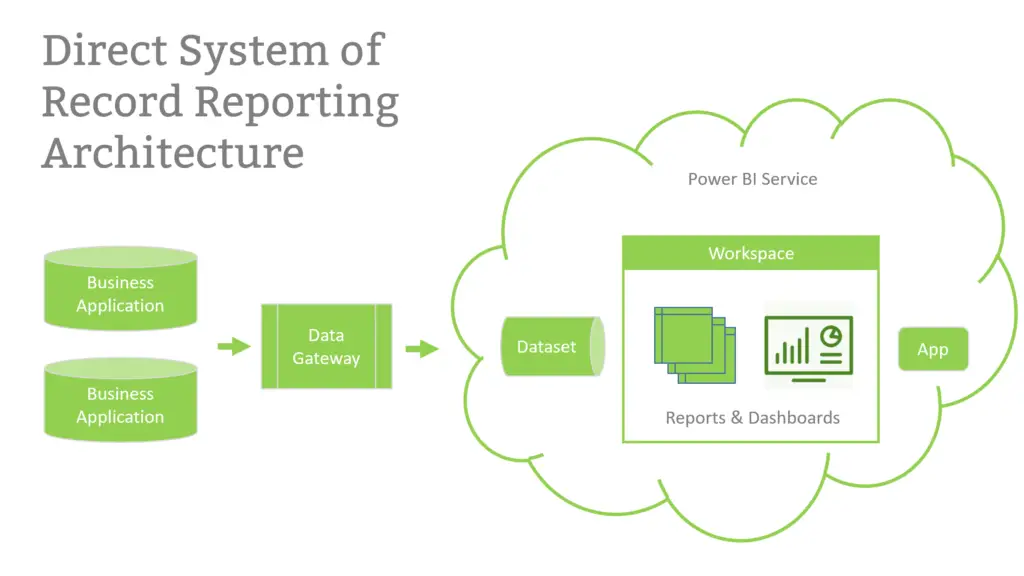
At LeapFrogBI we refer to this solution architecture as Direct System of Record Reporting. One of the great advantages of this approach is shorter development time. By leveraging the reporting tool, and only the reporting tool to house the reporting data, companies can avoid the need to design, develop and maintain a separate data solution. Since external data solutions have multiple components, the time and cost savings can be considerable, and often outweigh the inherent limitations of this approach.
To be clear, not all data visualization tools on the market are up to this task. Power BI, however, is more than just a visualization or dashboard tool. It is capable of sourcing data from nearly any sources, but more importantly it includes powerful data integration and transformation capabilities that most data viz tools lack.
Let’s take a quick look at 3 key features in Power BI that can be leveraged to allow enterprise-class analytics without an enterprise-class investment: the xVelocity engine, the Query Editor, and Import mode.
xVelocity Engine
The “engine” is what drives the core functionality of a piece of software. In this case, it is an analytics engine designed to process a lot of data in a short amount of time. That is achieved via two primary mechanisms common to most analytics engines:
- In Memory processing
With in-memory processing, all the data crunching and calculation is being done in memory, not on disk. That makes it lightning fast. - Column storage
Column storage is a method of database storage that is optimized for reporting and analytics. With xVelocity column stores, the data is compressed to up 10x. That reduces the size of your data model, which in turn, makes it even faster.
Under the hood, Power BI contains the same engine that the enterprise class SQL Server Analysis Services uses. Yes, you heard that correctly: Power BI uses a built-in, enterprise-class analytics engine, right out of the box. No enterprise license required. No additional cost. No additional hardware.
Query Editor
The Query Editor in Power BI Desktop contains a powerful set of data transformations, using a language called “M” (commonly referred to as Power Query). When it comes to data manipulation and cleansing, it rivals, and in many cases surpasses, SQL. You can merge (join) and append (union) data, but you can also transpose, pivot and unpivot, or add custom columns with a few clicks.
It doesn’t matter what shape your data is in – the query editor enables you to create the same star schema a proper data warehouse uses, even if your data came from an Excel worksheet. Each transform step is saved, then applied sequentially at each data refresh, and the steps can be edited if your data changes. The graphical interface means fast, efficient development; and the saved steps means you only model once.
Import Mode
Power BI supports multiple connection modes: Import, Direct Query, and Live Connection (which is a special case of Direct Query). There are pros and cons for each method, but the one that matters most for this discussion is related to where the in-memory data processing happens.
When you use import mode and publish to the Power BI service, you get to use Microsoft’s plentiful Azure resources. When you use Direct Query or Live Connection, you are using your local resources. If you do not have a lot of money to throw at infrastructure, you are much better off using Microsoft’s.
Import mode has a limitation though – a data model cannot exceed 1GB. Fortunately, the 10x compression enabled by xVelocity means it is extremely unlikely a single data model would ever exceed that threshold. I have created data models with hundreds of millions of records that did not break 150 MB.
So – No data warehouse? No problem! It will be faster and less expensive to start your reporting solution journey without one.