LeapFrogBI’s Data Stories spotlight real-world, niche business challenges—and show how a data-driven mindset always leads to better decisions, smarter problem-solving, and measurable results.
Because no matter the industry, the answer is in the data.
Fatal car accidents are often assumed to be the result of poor weather or nighttime driving. But what actually happens when you dig into the data? In this Data Story, we explore how business intelligence tools can uncover surprising patterns in traffic fatality data and help insurers, policymakers, and safety experts make smarter decisions that target real risks, not just perceived ones.
Challenge: Fatal Accident Risk Is Misunderstood—and That Leads to Missed Insights and Misguided Strategies
Ever find yourself white-knuckling the steering wheel in a downpour or snowstorm, thinking, “This must be when most of the really bad accidents happen”?
It’s a common thought. But when you actually dive into the data, a different story emerges.
Take the National Highway Traffic Safety Administration’s Fatality Analysis Reporting System (FARS), for example. This is a massive, complex dataset, and let’s be honest—raw data isn’t exactly a beach read. But when you start asking the right questions and using smart tools to help visualize the answers, some genuinely eye-opening patterns emerge.
That’s the opportunity—and the obstacle. A dataset like FARS can tell a powerful story, but only if you know how to ask the right questions. Too often, decisions around risk are shaped by assumptions rather than actual trends. And while rich datasets exist, most organizations lack the time, tools, and expertise to extract useful insights from them.
The result? Overgeneralized safety campaigns, missed opportunities for targeted prevention, and risk models that don’t reflect real-world conditions.
Why This Challenge Matters: The Risk Factors We Think We Know Might Be the Wrong One
What did we find in the FARS data that challenged our assumptions—and why does it matter?
Most Fatal Accidents Happen in Clear Weather, Not Bad Conditions
Turns out, a huge chunk of fatal accidents don’t happen in those dramatic storms. They happen on clear days in broad daylight—kind of counterintuitive, right?
This data suggests that when conditions seem perfect, other overlooked factors (like complacency or distraction) may creep in with devastating consequences.
Speed and Alcohol Remain Top Contributors to Fatal Crashes
This one is less surprising, but the data screams it loud and clear: Speeding and alcohol are consistently major players in fatal car crashes.
It might not be news, but seeing it laid out starkly in the numbers really underscores the ongoing need for greater education, awareness, and effective interventions.
Vehicle-to-Vehicle Collisions Dominate—But the Real Insights Are in the Details
It goes without saying that most fatal accidents logged by FARS involve vehicles colliding with other vehicles. But what is eye-opening is when the data starts to unpack that massive category.
After all, while vehicle-to-vehicle crashes are the most common type of collision, there’s far more going on than simply one car hitting another. The real insight comes from understanding patterns like:
- What types of vehicles are involved: sedans, motorcycles, pickups, SUVs
- Where the crashes happen: urban intersections, rural highways, school zones
- What the conditions are: daylight or night; wet or dry roads; speeding or no speeding
- Who is involved: drivers’ ages; presence of passengers; impairment factors
With the right tools and analysis, unlocking insights at this level of detail is what truly drives progress in traffic engineering, vehicle manufacturing, road safety policy, insurance underwriting, and public education efforts.
In short, the value of the data isn’t just confirming known risks; it’s challenging blind spots and making invisible trends visible. That’s what turns data into a tool for real change, shifting the focus from broad assumptions to targeted, actionable insights that drive smarter decisions for risk mitigation, insurance policies, and safety innovation.
Solution: How to Find the Answer in the Data
At LeapFrogBI, we believe even complex, government-grade datasets like FARS can be made usable, actionable, and valuable for businesses—if analyzed with the right tools and the right approach.
Here’s how we use data to help stakeholders in insurance, transportation, and safety make more informed, proactive decisions:
1. Support Fairer Risk Assessments
We help businesses understand the contributing factors behind fatal accidents (e.g., road conditions, driver behavior, or time of day) so they can build a clearer, more accurate understanding of where risk truly lies. In turn, this helps create more accurate and equitable risk models.
2. Guide Targeted Prevention Strategies
By mapping when, where, and why accidents occur, we make it easier to identify problem areas and support smarter safety campaigns, policy changes, or infrastructure improvements.
3. Surface Opportunities for Product Innovation
Our analysis reveals driving trends and behavioral patterns that can inspire insurers to explore new types of coverage or develop incentives aligned with actual road behavior—not just demographic assumptions.
4. Streamline Claims and Internal Processes
We turn patterns in accident data into tools that can help teams anticipate volume, validate submissions, and reduce time spent resolving cases—making tough moments smoother for everyone involved.
By breaking down large, often cumbersome public safety datasets into visual, accessible formats, we help businesses not only understand the data but know what to do with it next.
Sample Visualization: See the Data-Driven Mindset in Action
The visualizations in the report we created only scratch the surface of how we can analyze and digest the FARS data to reveal hidden patterns in fatal accident trends.
With the proper tools and data-driven approach, we can surface insights that have been buried in plain sight—and use them to help you make smarter decisions.
Total Fatalities and Total Accidents by Year and Month
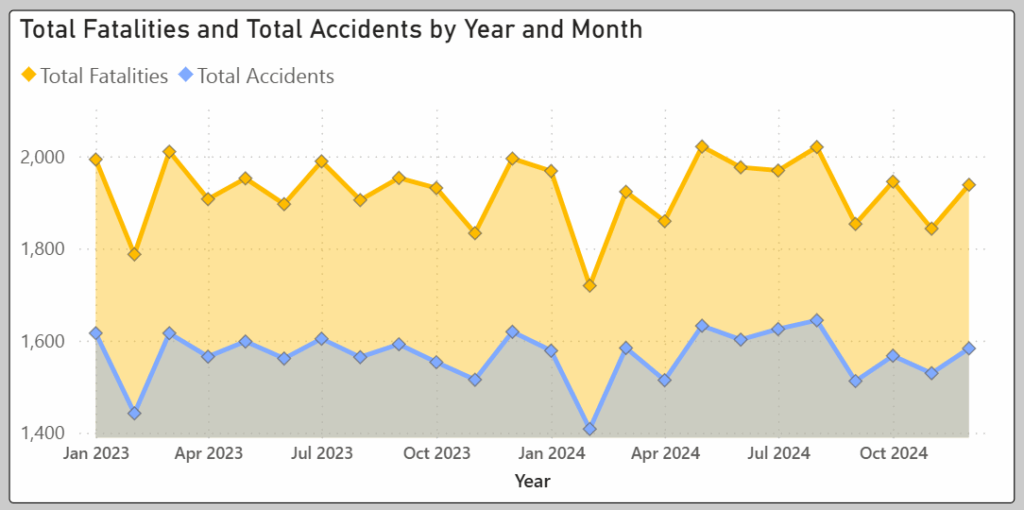
The line chart allows us to drill down into specific time frames where accidents may be more prevalent.
Percent of Total Accidents By Manner of Collision
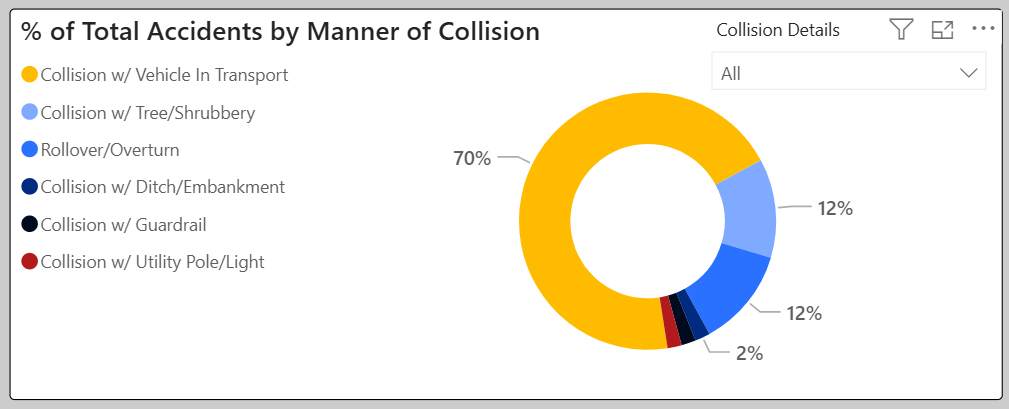
Most accidents involve other moving vehicles, while rollovers and collisions with trees are also common. This chart breaks down the types of crashes to show where the biggest risks lie.
Total Vehicles Involved By Lighting and Conditions
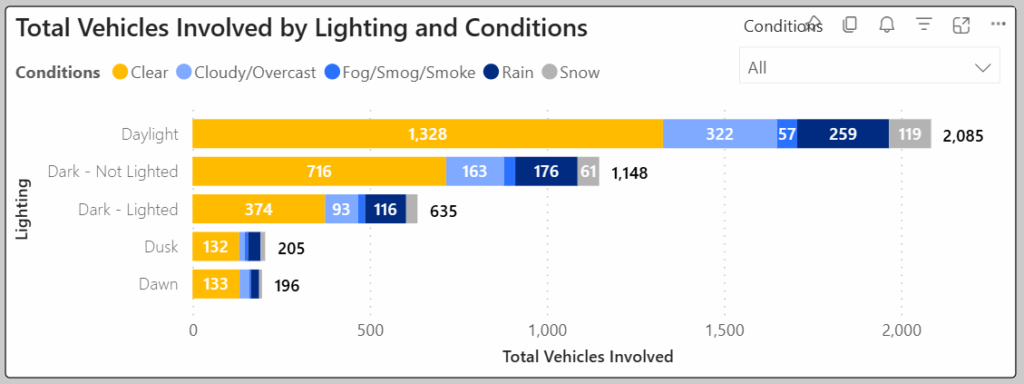
Accidents are most common in clear daylight, but dark and poorly lit conditions still pose serious risks, especially when combined with bad weather.
Business Impact: Data-Backed Insights for Safer Roads and Smarter Risk Models
At LeapFrogBI, we believe data truly tells a story, but sometimes it needs a good translator.
Our approach isn’t tied to one specific method or industry. Instead, we start by understanding your unique goals. Then, we apply the right tools and expertise to build custom solutions that fit your business’s needs and respond to your more pressing challenges.
On top of that, we prioritize robust modeling and clear, interactive ways to share these insights because data is only valuable when it’s understood and leads to action
Key Takeaways: Why the Answer Is in the Data
These examples highlight just a few of the ways data can reveal new opportunities to improve public safety and risk strategy.
The answers are in the data—but only if you know where to look. With these principles, we can turn your data into strategic wins:
- The story the data tells may be different than what you assume—especially when it challenges “common sense” about risk.
- Digging into high-level categories (like vehicle collisions) reveals deeper patterns about who’s involved, where it happens, and under what conditions.
- Clear, interactive dashboards turn massive, intimidating datasets into tools anyone can use to ask better questions—and act on the answers.
Every industry has its assumptions. A data-driven mindset helps you test them, improve them, and build smarter strategies that move everyone forward.
Explore Other Data Stories and Submit Your Industry
Explore more LeapFrogBI Data Stories to see how other industries are solving problems with data:
Got a business challenge you’d like us to explore? Contact us to share your industry challenge—and we might feature it next.
Because no matter the industry, the answer is in the data.