LeapFrogBI’s Data Stories spotlight real-world, niche business challenges—and show how a data-driven mindset always leads to better decisions, smarter problem-solving, and measurable results.
Because no matter the industry, the answer is in the data.
Operating rooms are among the most resource-intensive areas in any hospital—and often the most critical to overall financial performance. Yet even high-performing ORs leave efficiency gains on the table due to hard-to-see scheduling gaps, underused time blocks, and small delays that quietly add up.
In this Data Story, we explore how hospital leaders can use data to identify inefficiencies in OR utilization, improve time management, and reduce hidden costs to ultimately make the most of every surgical minute.
Challenge: OR Inefficiency Is a Hidden Drain on Profitability
In most hospitals, the operating room is the financial engine. According to data from J Orthopaedic Experience & Innovation, ORs account for approximately 60–70% of patient revenues and 35–40% of total hospital costs. As such, optimizing OR efficiency is not just an operational necessity—it’s a critical component of financial viability.
But many hospitals struggle to track the right indicators or interpret the story the data is telling them, such as:
- Underutilized ORs represent significant lose revenue potential
- Excessive turnover times drive up labor and operational costs
- Low First Case On-Time Starts (FCOTS) create ripple effects that disrupt daily workflows and reduce overall throughput
Despite best efforts, many hospitals struggle to identify which operational levers to pull to improve efficiency and how to interpret their performance across service lines.
Why This Challenge Matters: Small Inefficiencies Add Up Quickly
While some inefficiencies may seem minor at first glance (e.g., a 10-minute turnover delay), they scale fast across hundreds of cases.
Using data from The Journal of Orthopedic Business, LeapFrogBI created a Power BI report to analyze the turnover in operating room time. In one example, maintaining a 30-minute turnover costs $3 million per quarter. Reducing turnover to 20 minutes results in over $1 million in savings and frees up 367 hours of surgical capacity. Even a 5-minute improvement delivers $500K in savings and adds 186 hours of OR time.
These inefficiencies not only reduce OR throughput but also inflate labor costs, increase stress on staff, and contribute to underutilized capacity.
With that much at stake, tracking the right metrics becomes a strategic imperative.
Solution: How to Find the Answer in the Data
To drive measurable gains, hospitals should closely monitor and act on performance indicators that track both resource use and time efficiency. Each of these metrics contributes to a clearer understanding of where inefficiencies are occurring and where targeted improvements can create the greatest impact.
Here’s how we can use data to spot inefficiencies and develop targeted strategies for surgical team effectiveness to improve overall OR performance:
1. OR Utilization
OR utilization measures how much of the available OR time is used for actual surgical cases. It’s calculated as Actual OR Time / Available OR Time. Consider this industry standard benchmark.
- Benchmark Goal: 75–85%
- Typical Range: 50–60%
- Red Flag: Below 40% may indicate systemic operational issues
Using a sample Operating Room Dataset created by Jennifer Falk shows utilization rates consistently hover in the mid-60% range. While this may be within the “typical” band, it’s still well below the optimal goal, suggesting untapped potential that could be addressed by optimizing other related metrics.
By monitoring this metric over time, we can help hospital leaders determine whether scheduling processes and team coordination are delivering peak efficiency—or leaving capacity underused.
2. Block Untilization vs OR Utilization
It’s important to distinguish between these two metrics:
- Block utilization evaluates how efficiently surgeons or service lines use the time allocated to them.
- OR utilization focuses on system-wide operational efficiency and includes metrics like Turnover Time and FCOTS.
Most hospitals tend to focus more on block utilization, potentially overlooking valuable insights from OR utilization. But with a balanced view of both, we can help leadership surface whether delays are provider-driven or operational in nature.
3. First Case On-Time Starts (FCOTS)
As Plato once said, “The beginning is the most important part of the work.” While not written with surgical workflows in mind, this philosophy applies surprisingly well to the OR setting.
FCOTS tracks whether the first scheduled surgery of the day begins within a set window (typically 10 minutes) of its scheduled time. High-performing organizations strive for a FCOT rate of 90% or greater, according to Plante Moran.
- Benchmark Goal: 90%
- Red Flag: Below 40% may indicate serious operational or staffing issues
A delayed first case creates a ripple effect, leading to cascading delays and even cancellations later in the day. Timeliness in first cases reflects how well-prepared and synchronized the OR teams are. In our sample report, the FCOTS rate is 88%—just shy of the benchmark. This indicates solid performance in this area, suggesting that FCOTS is likely not the primary driver behind our lower utilization rate according to Plante Moran.
By analyzing trends and patterns in the data, we can identify opportunities to introduce practical interventions, e.g., establishing a daily pre-op standup to review first cases of the next day and preempt known bottlenecks.
These brief meetings, focused on reviewing the first cases of the next day, can uncover and address logistical bottlenecks early. For instance, if a complex case requiring same-day testing is in the first slot, moving it later could significantly improve the morning flow.
4. Turnover Time
Turnover time happens when one patient exits the OR and the next one enters.
- Benchmark Goal: 20 minutes (according to Plante Moran)
- Demo Average: 30 minutes
At first glance, a 10-minute overage may not seem significant—but this inefficiency scales rapidly. Turnover time is often a silent cost driver, impacting the total number of procedures that can be performed each day and inflating labor costs. Based on industry data, the cost of OR time is $46.04 per minute. With a 10-minute surplus across hundreds of cases, the financial implications are substantial.
With a deep look at turnover data, we can help teams highlight bottlenecks and prioritize targeted improvements to optimize scheduling and reduce delays.
5. Unused Capacity
When ORs sit idle outside of scheduled cases and turnover, this becomes unused capacity. In our sample report (link the report), the OR has 492 hours of unused capacity.
This is time that could otherwise generate revenue and serve patients. Often, it stems from poor scheduling, underutilized provider blocks, or low demand relative to capacity.
By tracking this metric, we can help facilitate discussions around schedule optimization, resource balancing, and service line performance
6. Scheduled vs Actual OR Time
Disparities in scheduled vs actual OR time often stem from:
- Inaccurate case duration estimates
- Poor scheduling protocols
- Team performance issues
These inconsistencies make staffing and scheduling harder and can lead to either underutilization or excessive costs.
With the data, we can help OR managers compare forecasted vs actual case times and identify the root causes of variance to support more reliable planning.
Scenario-Based Cost and Efficiency Impact
After analyzing the metrics, we identified two primary areas of inefficiency:
- High turnover time (30 minutes vs 20-minute benchmark)
- Unused capacity (492 hours quarterly)
Using the scenarios analysis from our sample report, we evaluated cost implications and time savings tied to changes in key performance metrics:
- Maintaining a 30-minute turnover costs $3 million per quarter.
- Reducing turnover to 20 minutes results in over $1 million in savings and frees up 367 hours of additional surgical capacity.
- Even a 5-minute improvement delivers $500K in savings and adds 186 hours of available OR time.
This demonstrates that small, incremental improvements in efficiency can yield significant financial and operational gains over time.
Opportunities for Further Analysis
OR utilization is the tip of the iceburg. To go beyond operational efficiency and create a more holistic improvement strategy, teams can also consider:
- Correlating turnover time with patient outcomes: Longer turnover may indicate inconsistent protocols, potentially impacting sterility or patient safety.
- Correlating FCOTS with patient satisfaction: A smoother surgical experience—starting on time and running to schedule—can improve HCAHPS scores and patient confidence.
Sample Visualization: See the Data-Driven Mindset in Action
Q1 Operating Room Efficiency
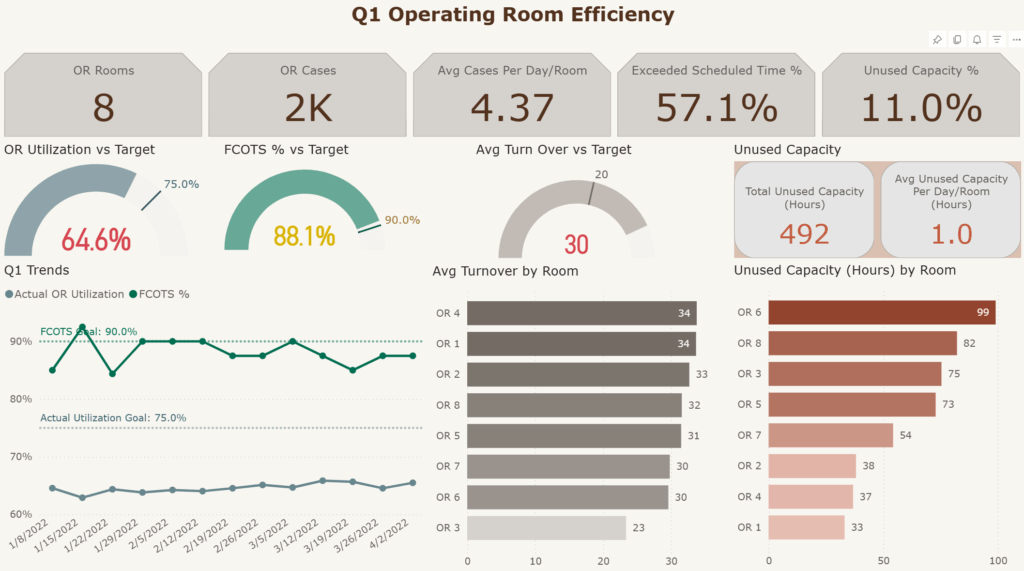
This dashboard gives us a high–level view of Q1-2022 KPI and performance vs. targets which helps identify issues that need to be addressed. In this example, we can easily see that OR Utilization is lower than our target. Further, we can see that Average Turn Over is a significant factor in missing the target.
Q1 Operating Room Turn Over Scenario Analysis
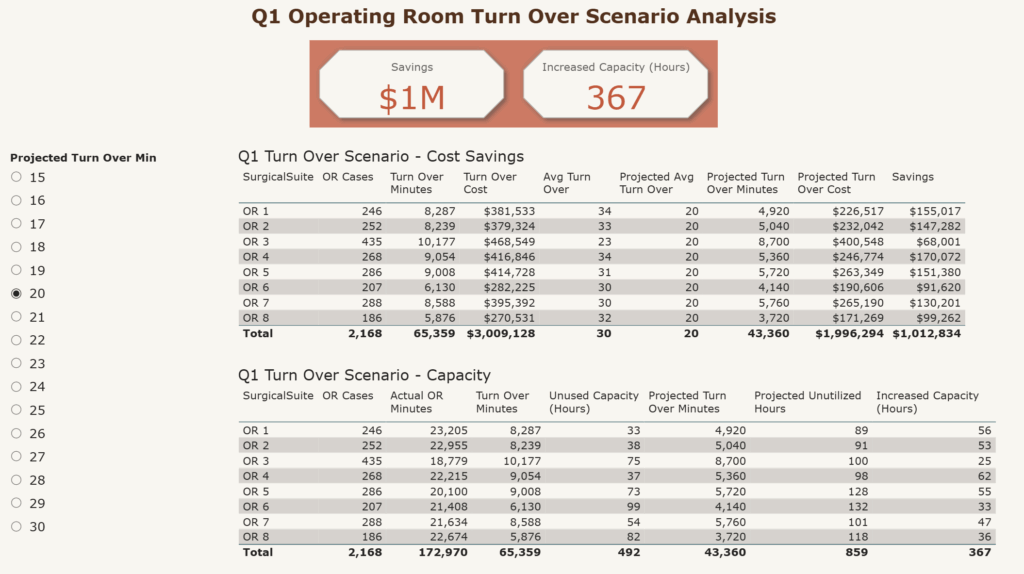
Since we have identified the average turn over time as the main culprit behind our missed target, we can use this analysis tool to understand the impact. Reducing turn over time will save money as well as add capacity, which in turn will generate more revenue. By selecting the desired turn over time, we can project how much impact the change will have in real terms. This tool can be used to show that even small improvements can have a big impact.
Business Impact: Small Efficiency Gains, Big Financial Results
Operating room efficiency is one of the most direct levers healthcare leaders can pull to improve both financial performance and quality of care.
At LeapFrogBI, we can help hospitals unlock that potential through targeted data analysis, scenario modeling, and interactive dashboards tailored to your unique environment. By closely tracking metrics like utilization, turnover time, and FCOTS, as well as applying targeted interventions, hospitals can create a more agile, profitable, and patient-centered surgical environment.
Data helps you move from guesswork to precision and drive measurable improvements in both care delivery and cost efficiency.
Key Takeaways: Why the Answer Is in the Data
These examples highlight just a few of the ways operational data can reveal untapped potential to improve surgical efficiency, cost control, and patient care.
The answers are in the data—but only if you know where to look. With the right metrics and mindset, we can turn OR inefficiencies into opportunities:
- The story your OR utilization data tells may differ from what feels “normal,” e.g., mid-60% performance is common, but still falls short of the 75–85% efficiency benchmark.
- High FCOTS performance isn’t just a scheduling goal—it’s a signal of strong team coordination and can reduce delays across the entire day.
- Even modest improvements, like a 5-minute gain in turnover, can drive $500K in savings and free up nearly 200 OR hours.
Clean, well-designed dashboards turn complex metrics into clear action plans, making it easier to spot patterns, prioritize improvements, and justify change.
From staffing to scheduling, the operating room is filled with moving parts. Data gives you the visibility to synchronize them all—and the insight to lead with confidence.
Sources
Explore Other Data Stories and Submit Your Industry
Explore more LeapFrogBI Data Stories to see how other industries are solving problems with data:
Got a business challenge you’d like us to explore? Contact us to share your industry challenge—and we might feature it next.
Because no matter the industry, the answer is in the data.