
The State of a Data Team at Small and Midsized Companies
LeapFrogBI researched 1,800 companies on LinkedIn, 95% of which had 1,000 or less employees. We were specifically looking at companies in healthcare, insurance, or banking.
LeapFrogBI researched 1,800 companies on LinkedIn, 95% of which had 1,000 or less employees. We were specifically looking at companies in healthcare, insurance, or banking.
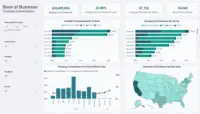
This report gives insurance professionals visibility into key revenue metrics such as Executive Summary, Premium Growth, Policy Growth, In Force Book, Company Commissions, and Producer Commissions.

Few businesses feature as many moving parts as banking. A variety of existing products, each with specific rules, and a constant influx of new products
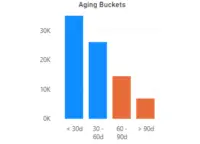
This report displays both trend and point-in-time information about claim denials. RCM Managers can use to see general trends while capturing outliers.
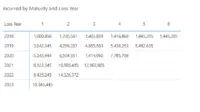
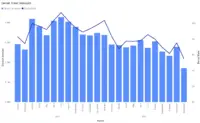
Explore how this Power BI report brings together claims and incurred loss data in one easy-to-use dashboard. See how visual insights can support smarter decisions across your insurance business.
Advantage Surgical and Wound Care uses LeapFrogBI to transfer manual data labor into data-driven decisions.

Running a business is hard enough. With all the hype around information technology and how integral it is to doing anything in this world, business

In the late 90s, as the internet came of age as a place where real business could take place, we started hearing of a new

The old debate The build-vs-buy conundrum is a time-honored business hot topic. As the pendulum has come and gone, the evidence can be made to
This dashboard demonstrates how billing and claim denial data can be combined to provide a clear view of an organization’s cash flow trends. By continuously monitoring these metrics, the Finance team can take proactive steps to address issues and avoid potential financial challenges.