Category: Report Library

CrossFit Athletic Demographic Distribution

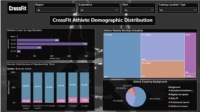
CrossFit Athlete Demographic Distribution Report

CrossFit is a dynamic and fast-growing industry where data can play a powerful role in driving business performance. While CrossFit gyms aren’t currently clients of LeapFrogBI, we created this report using sample data as a project to explore how analytics could support gym owners in making smarter decisions.

bar chart productivity

Insurance Productivity

This report focuses on book growth metrics. It lists each key growth driver and displays both point in time and trend information.

bar chart

Insurance Claims Analysis

This report shows trends and key metrics on book performance. It combines both earned premium and incurred losses to produce a complete picture of book profitability. 

Insurance book of business report

Insurance Book of Business: Power BI Reports

This report gives insurance professionals visibility into key revenue metrics such as Executive Summary, Premium Growth, Policy Growth, In Force Book, Company Commissions, and Producer Commissions.

Insurance claim denial report

Health Care: Claim Denials Report

This report displays both trend and point-in-time information about claim denials. RCM Managers can use to see general trends while capturing outliers.

loss triangle report

Insurance: Loss Triangles

Explore how this Power BI report brings together claims and incurred loss data in one easy-to-use dashboard. See how visual insights can support smarter decisions across your insurance business.

Charge Lag Capture

Healthcare: Charge Lag Capture Sample Report

Discover how charge lag impacts your bottom line the most with this interactive Power BI report. Dive into trends, identify top offenders, and explore metrics by location, procedure, and payer—all designed to help finance, RCM, and leadership teams drive timely action.

Insurance KPI: Written Premium

Explore this interactive report to see how written premium reveals the size, growth, and performance of a insurance book of business. Uncover key drivers like producers, underwriters, and business segments to better understand what’s fueling the results.

Insurance Dashboard and Reports (Sample Data)

This interactive insurance dashboard showcases how “report-ready” data can be easily explored using Power BI. Navigate through pages like Producer Revenue, Premium Plan, and Policy Overview to gain valuable insights tailored to different areas of your business.

Gross profit and gross margin by full date - sales dashboard

Sales Dashboard and Reports (Sample Data)

This interactive live dashboard lets you explore and engage with the data. It shows how information can be tailored for different stakeholders and how one visual can instantly filter others on the same page for deeper insights