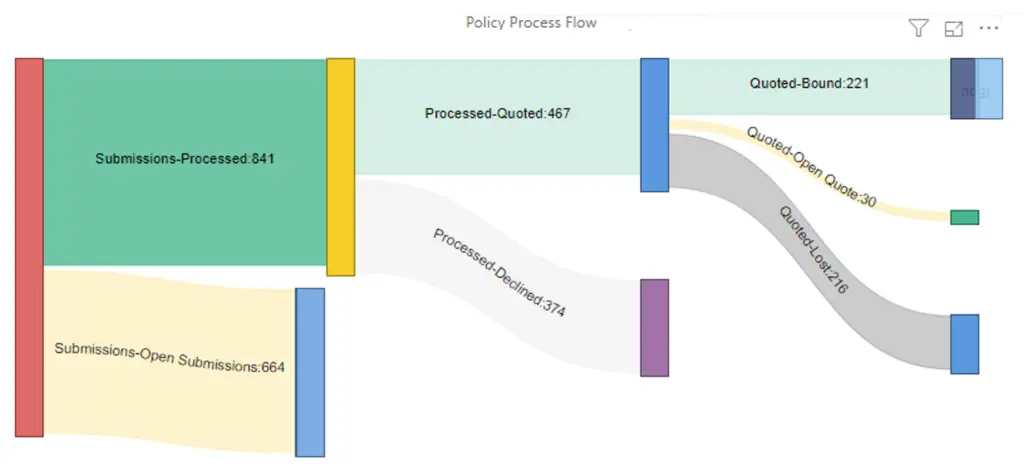
Insurance underwriting efficiency analytics help carriers and managing general agencies optimize outcomes. This process diagram tracks policies from submission to bound.
What it is:
One example of insurance underwriting efficiency analytics is this Sankey chart. It is used to track the flow of policy submissions. Ideally it can be filtered by time, underwriter, broker, line and other relevant dimensions.
Why it matters:
Insurance underwriting efficiency analytics like this provide direct, immediate feedback to all participants in the insurance sales and underwriting pipeline. Our insurance clients use it for process management, training and financial planning.
How it’s made:
Often the most important insurance analytics are the hardest to generate. Insurance underwriting efficiency visualizations like this are no exception. In most cases, the reporting requirements demand a robust data solution like a data warehouse be part of the solution. You can read why in How Insurance Business Intelligence will Transform your Business. If you’re considering such an investment, be sure to read Getting your insurance data warehouse right.
In order to produce this visual we must know the quantity of submissions in each possible status (submitted, quoted, declined, etc.), broken down by each relevant dimension (line, underwriter, etc.). If we want to be able to filter the visual by time, or track trends over time, it gets even more complicated. We don’t just need to know the current status, we also need to know the status of every submission during each time interval throughout its lifecycle.
If status history exists in the source system it is usually incomplete. This may be due to shortcomings in the system, or a lack of necessary business process or business rule enforcement. From the available data we need to create a clear sequence of events for each policy that contains the starting and ending status for each status change date. Often we need to manufacture records where they don’t exist, and we do this by developing and applying business rules. For example, we ensure every policy starts as “submitted”, and each submission is subsequently closed or further processed, etc.
In the insurance data warehouse we automate this data manipulation, along with any other transformations necessary to clean, filter and organize the data, so the process runs frequently on its own. The end result is report-ready data that anyone can easily investigate and visualize using any modern data visualization tool.
For more information on advanced insurance analytics…
READ THIS:
Want to see and explore a sample insurance dashboard and reports?
SEE THIS: